
Green Month for Bitcoin
....................................................................................................................


Happy Friday, traders.
The shutdown drama is still hanging over Wall Street, but markets aren’t slowing down. Stocks climbed to fresh records Thursday as OpenAI’s $500B valuation sent AI optimism soaring, making it the most valuable startup in the world.
Normally, traders would be laser-focused on today’s jobs report, but the release is delayed thanks to the shutdown - leaving everyone guessing about the Fed’s next move.
In Washington, the standoff drags on, with Democrats holding firm on healthcare subsidies and Republicans refusing to deal until the government reopens.
Meanwhile, Bitcoin carried September to a green finish even as most altcoins bled red, keeping the bull case alive into October.
Let’s get into the details.

📈 Record Highs as Stocks Defy Shutdown
Stocks ripped past 6,700 while Washington bickers. The market only cares about one thing: cheaper money.
🤖 OpenAI Rockets to $500B; Beats Musk’s SpaceX
Altman’s shop just leapfrogged SpaceX, locking in the crown as the world’s biggest startup. Traders call it the AI bubble’s loudest flex yet.
📈 Cathie Wood Ark Loads China Bags
Cathie Wood’s Ark dropped millions into Alibaba and Baidu, doubling down as both stocks hit multi-year highs.
🪙 Uptober Ignites Crypto
BTC ripped past $117K, ETH cleared $4.3K, and XRP’s eyeing $3 as the new month kicks off in full bull mode.
⚖️ Supreme Court Decision Boosts the Dollar
With Cook staying (for now), Fed independence fears cool off, but traders still eye shutdown risks and missing jobs data.
🟢 Green Month for Bitcoin, Red Screen for Alts
82% of coins are down today, but zoom out - September’s ending with gains, thanks almost entirely to Bitcoin’s rally.
🔥 Gold’s Record Streak Holds
Five straight days of gains pushed bullion near $3,870 as traders piled into Fed cut bets and brace for a US shutdown.

The Only Way to Know If Trading Fits You Is to Start

You can spend months wondering if trading suits your personality, your goals, or your lifestyle.
But the truth is, no amount of thinking will give you that answer. The market only reveals itself when you step in.
Trading isn’t an all-or-nothing commitment. You don’t have to quit your job or pour in massive capital on day one.
You start small, test the waters, and let experience tell you if it’s a path worth pursuing.
Stop circling the question in your head. Clarity comes from action, not hesitation.
👉 Get your feet wet with trading newsletters that guide you step by step.

Simple Moving Average (SMA)
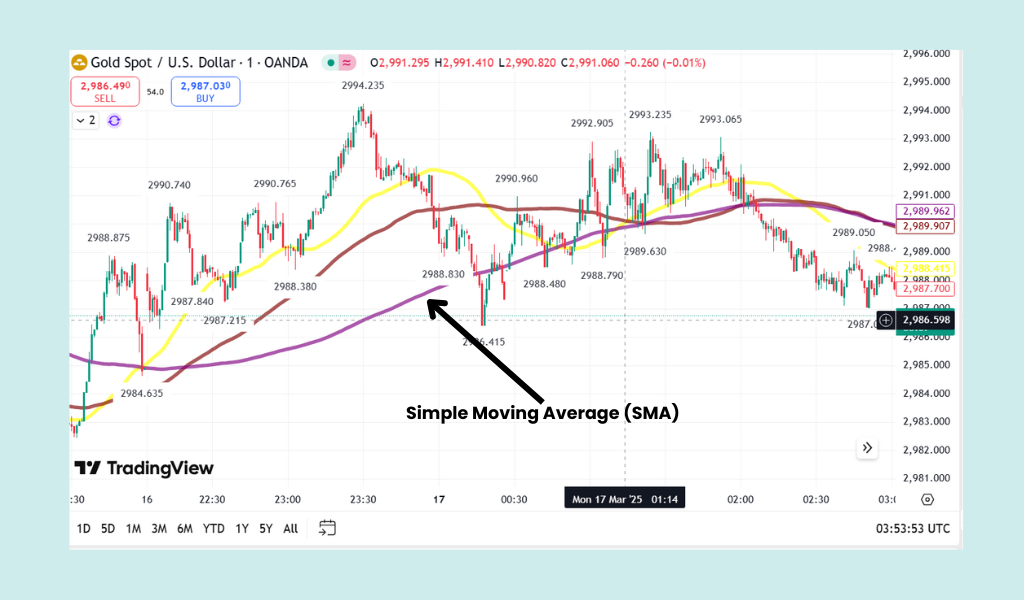
The Simple Moving Average (SMA) is a fundamental technical indicator that calculates the average price of an asset over a specific number of time periods (e.g., 50 days, 200 hours).
Its main purpose is to smooth out short-term price fluctuations ("noise") to reveal the underlying trend direction more clearly.
- Simple: It assigns equal weight to every price point in the calculation period.
- Moving: The line is constantly updated as each new price is added and the oldest price is dropped.
Calculation Example: A 10-period SMA is calculated by adding the last 10 closing prices and dividing the total by 10.
What to Look For
The SMA is a lagging indicator (it follows price) and is used primarily to define and confirm a trend.
1. Trend Direction
The slope of the SMA line instantly tells you the current trend:
- Uptrend (Bullish): The SMA line is sloping upward, and the price is generally above the SMA line.
- Downtrend (Bearish): The SMA line is sloping downward, and the price is generally below the SMA line.
- Sideways/Ranging: The SMA line is relatively flat, and the price crosses above and below it frequently.
2. Support and Resistance
SMAs are often used as dynamic (moving) support and resistance levels:
- Support: In an uptrend, traders watch for the price to fall back and "bounce" off the rising SMA line (often the 50- or 200-period SMA) before continuing higher.
- Resistance: In a downtrend, traders watch for the price to rise and be "rejected" by the falling SMA line before continuing lower.
3. Price Crossovers (Entry/Exit Signals)
A signal is generated when the price crosses the SMA line:
- Bullish Signal (Buy): The price moves and closes above the SMA line, suggesting momentum is shifting up.
- Bearish Signal (Sell): The price moves and closes below the SMA line, suggesting momentum is shifting down.|
4. Moving Average Crossovers (Major Trend Shifts)
Traders often use two SMAs of different lengths (e.g., a short 50-period and a long 200-period) to spot major trend changes:
- Golden Cross (Bullish): A shorter-term SMA crosses above a longer-term SMA. This is a strong signal for a potential long-term uptrend.
- Death Cross (Bearish): A shorter-term SMA crosses below a longer-term SMA. This is a strong signal for a potential long-term downtrend.

🛑 Don’t Force It
Traders, the shutdown drama is still in the air, and the market will play its usual games - volatility spikes, fake breakouts, and headlines designed to mess with your head.

Don’t fall in and be a victim.
It’s Friday. No need to overtrade or chase ghosts. Here’s how to keep it chill and sharp:
- Protect your stack. Lower your size or just sit this one out.
- Ignore the noise. Most moves will be engineered, not natural.
- Step back. The 4H and Daily charts tell the real story. Zoom out, breathe.
- Only act on proof. Wait for clean closes beyond levels—not guesses.
👉 Relax, reset, and head into the weekend with your capital intact. Sometimes the best trade is no trade.


