
Gold-Silver Pullback
....................................................................................................................


Good morning,
US stock futures are backing off to end the week as investors juggle two heavyweight narratives:
President Trump’s imminent pick for the next Fed chair and the final read on Big Tech earnings. Tech is leading the retreat, with Nasdaq futures sliding as markets digest a week that delivered both blockbuster beats and sharp disappointments.
The Fed storyline is front and center. Trump is set to name Jerome Powell’s successor, a decision that could reshape expectations around rate cuts and central bank independence. With rates just held steady — and markets still betting on cuts later this year — the choice signals how political pressure and policy might collide next.
On earnings, Apple offered a late boost with better-than-expected results powered by record iPhone sales, but the broader tech picture remains uneven. Microsoft’s sharp selloff earlier this week is still casting a long shadow, keeping investors selective rather than celebratory.
As January winds down, the market is still clinging to monthly gains — but this Friday feels less like a victory lap and more like a pause before the next big move.

📉 S&P 500 Futures Slip as Trump Signals Powell Replacement
U.S. stock futures edged lower after the S&P 500 logged a second straight loss, with markets on edge ahead of President Trump’s announcement of a potential new Fed chair.
🥇 Gold and Silver Pause After Historic Rally as Investors Reassess Entry Point
Precious metals took a breather after their explosive surge to record highs, prompting debate over whether the pullback offers a fresh buying opportunity. Gold plunged nearly $300 in two hours, sliding back to $5,100 an ounce as price swings reached levels last seen during the 2008 financial crisis.
🌏 Global Markets Slip After Wall Street Turbulence, Asia Ends Lower
Asian stocks fell following a volatile Wall Street session marked by Microsoft’s plunge, while oil, gold and silver prices weakened.
📊 SoFi Slides, but Retail Traders Double Down on Q4 Beat and S&P 500 Hopes
SoFi shares fell as policy uncertainty weighed on sentiment, even as retail investors bet that strong earnings and possible index inclusion could revive the stock.
💥 Bitcoin Plunges Nearly $10K, Triggering $1.7B Crypto Liquidations
Bitcoin sank toward $82,000, unleashing a $1.7 billion liquidation wave and dragging the total crypto market below $3 trillion.
🤖 OpenAI IPO Buzz Builds as Retail Eyes Potential $1T Valuation
Speculation intensified that OpenAI could go public as soon as Q4, with reports of banker talks and pre-IPO funding that could value the AI giant near $1 trillion.
🧨 Microsoft Suffers Worst Day Since 2020, Loses $357B in Market Value
Microsoft shares collapsed 10% in a single session, erasing $357 billion in market cap in the company’s steepest drop since the pandemic crash.

If Trading Didn’t Work, Markets Wouldn’t Exist
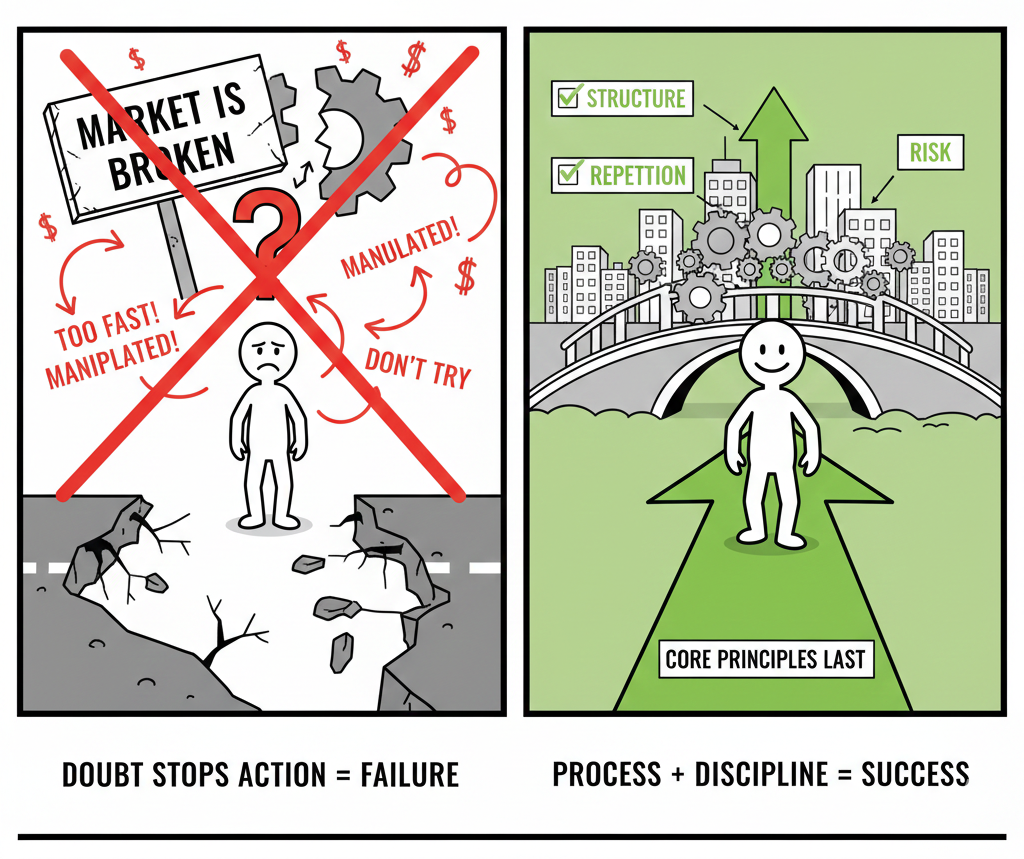
Every generation believes the market is broken. Too fast. Too manipulated. Too different from before. That belief usually appears right before someone decides not to try.
Markets exist because trading works. Not for everyone. Not instantly. But consistently for those who understand structure, risk, and repetition. Tools change. Speed changes. Access improves. The core principles stay the same.
What stops working is guessing, shortcuts, and impatience. When expectations reset, results follow. The market did not disappear. It still rewards preparation and discipline.
If you want guidance that focuses on timeless trading principles instead of hype or fear, these newsletters help. They break down how disciplined traders adapt without chasing trends.

Bearish Harami
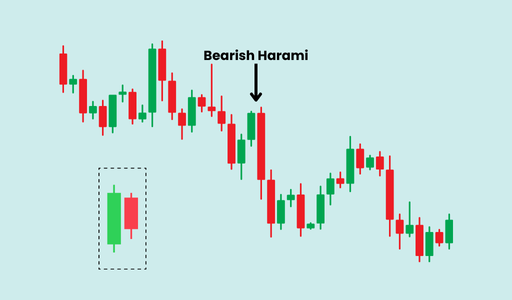
The Bearish Harami is a two-candle reversal pattern that signals a sudden "stall" in bullish momentum. It is the opposite of the Bullish Harami, appearing at the top of an uptrend.
The pattern consists of a large "mother" green candle followed by a small "baby" red candle that is completely tucked inside the first candle's body. It represents a moment where buyers have lost their edge and sellers are beginning to probe the market.
🛠️ The Strategy Logic
Use these logical triggers to identify when an uptrend is exhausted and a downward correction is likely:
- IF: The second (red) candle’s body is completely contained within the first (green) candle’s body...
- THEN: The pattern is valid. This shows that the market was unable to maintain its upward trajectory and has contracted into a state of indecision.
- IF: The Bearish Harami forms after a steep rally or at a major resistance level...
- THEN: The signal is high-probability. This suggests the market has hit a "ceiling" and the bulls are no longer willing or able to pay higher prices.
- THEN: The signal is high-probability. This suggests the market has hit a "ceiling" and the bulls are no longer willing or able to pay higher prices.
- IF: The second candle is a "Doji" (a tiny body with almost no height)...
- THEN: This is a Bearish Harami Cross. It is a more potent signal than a standard Harami because it represents total stalemate at the top of a trend, often leading to a more aggressive reversal.
- THEN: This is a Bearish Harami Cross. It is a more potent signal than a standard Harami because it represents total stalemate at the top of a trend, often leading to a more aggressive reversal.
- IF: The price breaks and closes below the low of the first (large green) candle...
- THEN: The bearish reversal is confirmed. This breakdown of the "mother" candle's base is the signal that sellers have officially taken control.
- THEN: The bearish reversal is confirmed. This breakdown of the "mother" candle's base is the signal that sellers have officially taken control.
- IF: The pattern is accompanied by an Overbought signal in the MFI or a drop in the Volume Oscillator...
- THEN: You have a "weakness" setup. The candles show the stall, and the indicators confirm that the buying "fuel" has been exhausted.
💡 Pro Tip
The "Inside Bar" Reality Check: Just like its bullish counterpart, a Bearish Harami is an "Inside Bar" setup. It signifies low volatility and consolidation. Many traders make the mistake of shorting immediately; however, the pattern can sometimes result in a "bull flag" if the trend is very strong. Always wait for the break of the mother candle's low to ensure the bears have actually won the tug-of-war before entering a short position.

When Comfort Replaces the Plan
This shift is easy to miss.
You do not wake up and decide to abandon your rules.
You simply stop checking them.
You enter because the setup looks familiar.
You hold because the drawdown feels manageable.
You size up because the last few trades worked out.
Comfort takes the wheel.
Instead of asking whether the trade fits your plan, you ask whether it feels fine.
That question sounds harmless. It is not.
Feelings change with mood, recent wins, and market noise. Your plan does not.
Comfort-led trading creates slow damage.
There is no blowup at first. Just softer stops. Looser entries.
Longer holds on trades that no longer deserve patience. Each decision feels reasonable in isolation. Together, they pull you off your edge.

Good traders treat comfort as a warning sign.
When a trade feels easy, they slow down. They go back to their checklist.
They confirm structure, risk, and size before acting.
The plan exists to protect you from yourself on your best days, not your worst ones.
The moment comfort starts guiding decisions, discipline is already slipping.


