
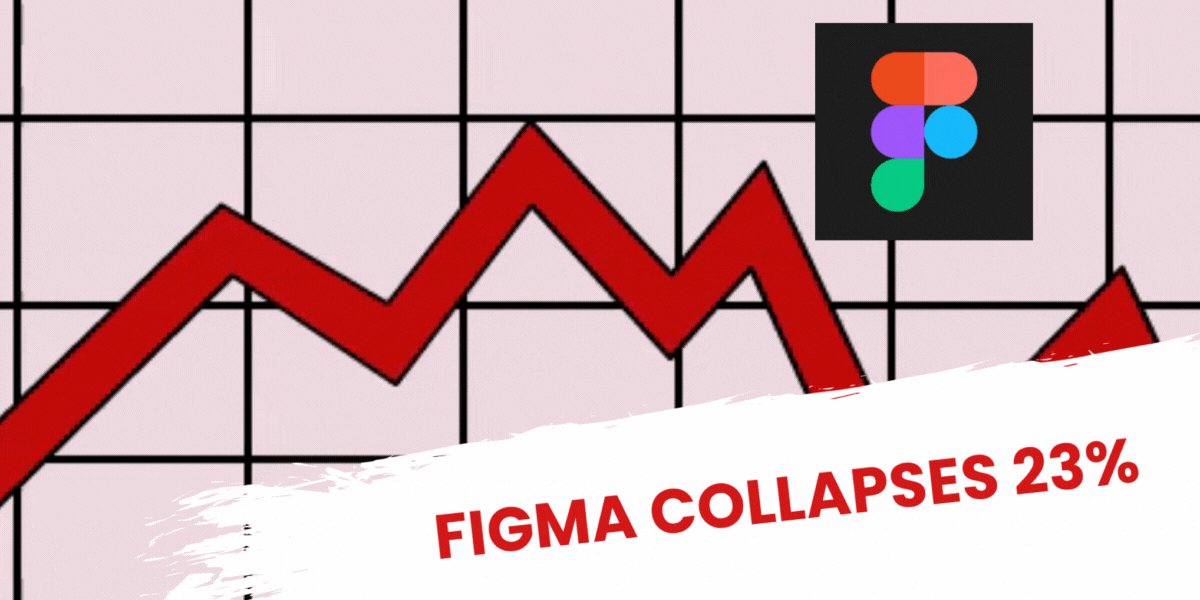
Figma Collapses 23%
....................................................................................................................


Let’s not sugarcoat it: this market’s testing patience.
One minute we’re climbing, next minute Figma erases its entire rally. Palantir’s breakout is real but so was Novo Nordisk’s flop.
Even American Eagle is suddenly a trader’s favorite off one headline after Trump boost.
This isn’t a time for guesswork.
When the data shifts like it just did with jobs and rate odds - we stay alert, not reactive.
There are names setting up cleanly right now. Familiar charts. Strong catalysts.
We’re keeping it tight this week and focused on what still makes sense.

📉 Figma Freefall Wipes Gains
Big names warned, the market blinked. Now Figma's back below $100 as sentiment shifts hard.
🚀 Palantir Explodes on AI Surge
Revenue up 48%, commercial sales nearly doubled—and Karp says the market’s just waking up. This ain’t hype, it’s a flex.
🦅 Trump Sends American Eagle Flying
Trump called it “HOTTEST.” Retail bros heard it loud. American Eagle ripped off controversy alone.
🩺 Novo Nordisk Breaks Down
Shares got smoked after guidance cut and CEO switch. Bulls watching $36, bears gunning for $29.
🔥 Stocks Pop, Cuts Coming?
Odds for a rate slash just hit 94%. Bears got blind-sided as bulls danced on soft jobs data.
💥 Nike Rallies on Earnings Beat
Stock popped 15% on surprise Q4. Analysts stay cautious, but JPM calls for a rebound to $93.
🎢 Wall Street Catch a Break
After a rollercoaster weekend, Wall Street steadied Tuesday as investors balanced Trump tariff worries with fresh optimism for Fed rate cuts and strong corporate earnings.

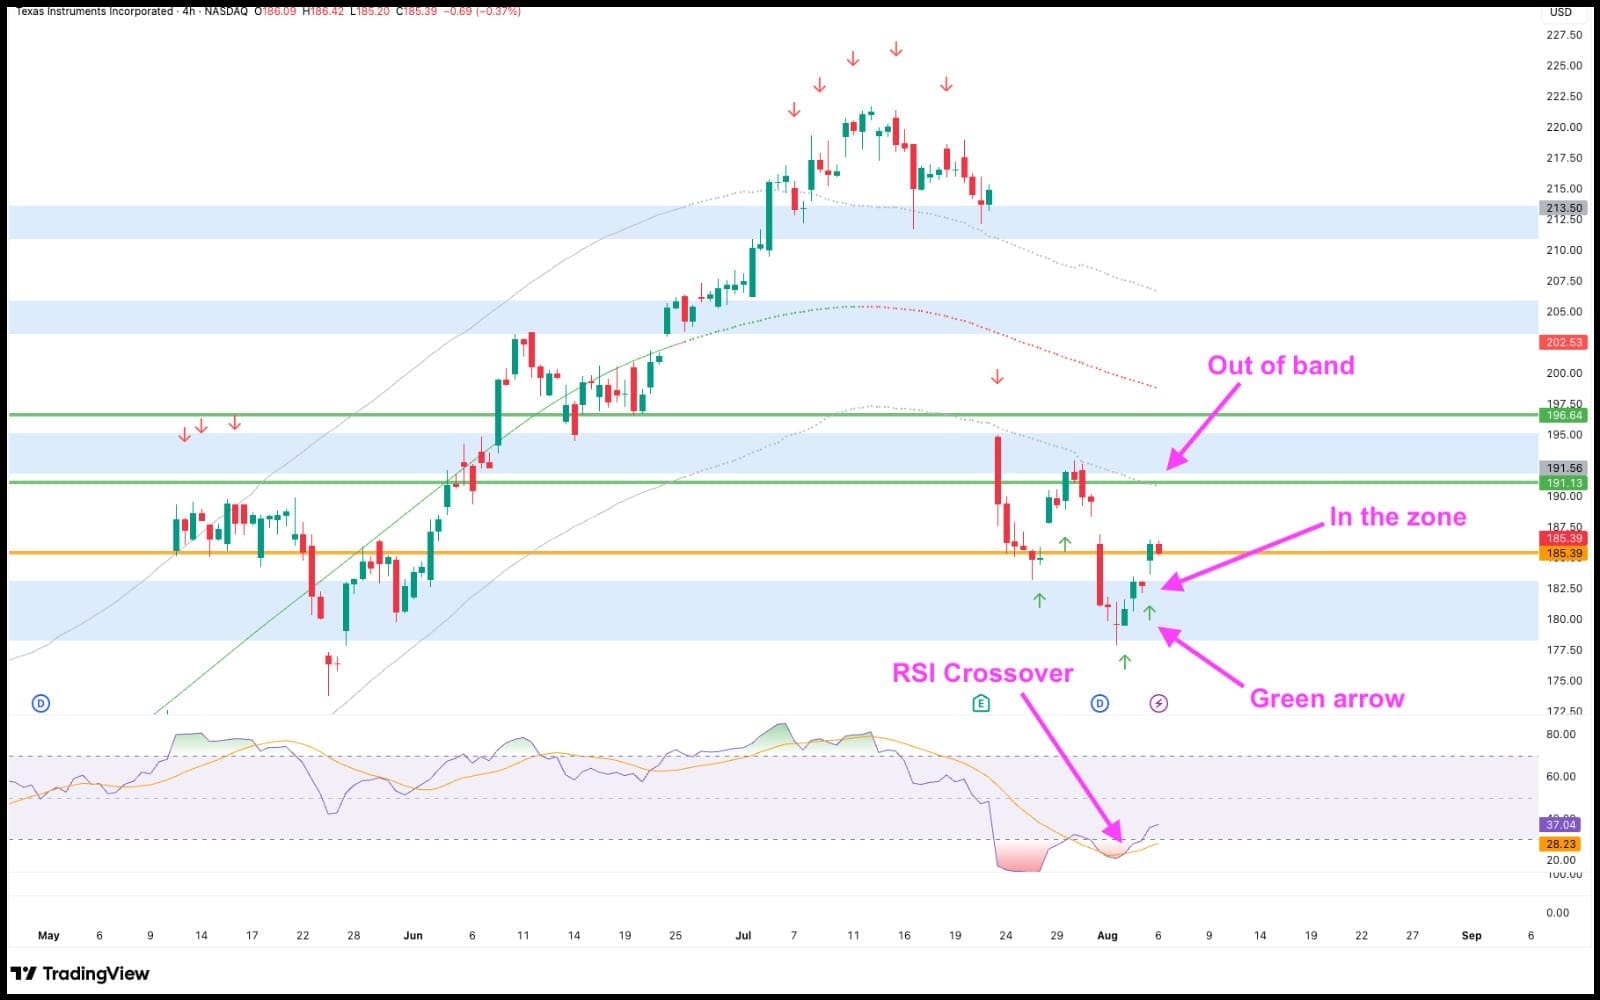
Recommendation: Texas Instruments Inc (NASDAQ: TXN)
This setup reminds me of that moment.
When the storm calms.
And the sea looks tradeable again.
TXN just pulled back cleanly into our zone with precision.
Right at a spot where buyers had stepped in before.
And RSI is curling back up - a sign that momentum might be building again. 💪
We’re entering a buy at $185.39
Targets:
Buy: $185.39
TP1: $191.13
TP2: $196.64
It’s not a wild breakout.
It’s a calculated step into strength.
Let’s ride this wave. ⛵

Trading Isn’t Rocket Science

Think you need to be a math genius to trade? Forget it. This isn’t quantum physics - it’s more like spotting recurring moves on a dance floor.
The truth is, trading isn’t about solving equations or memorizing formulas.
It’s about recognizing patterns, managing risk, and staying consistent.
Some of the most successful traders couldn’t tell you what sine or cosine means - but they can tell when a breakout’s coming just by reading a chart.
If you’ve been holding back because you “suck at math,” it’s time to drop that excuse.
What you really need is an eye for trends, a system that works, and the emotional control to stick to it.
And the right trading newsletters can help you build that - offering clear strategies, real setups, and insights that don’t require a math degree to follow.
👉 Here’s a shortcut to smarter (not harder) trading.

Doji

The Doji is a single-candlestick pattern that signals indecision in the market.
It forms when the open and close prices are nearly identical, creating a very small or non-existent body.
What to Look For
- Small Body: The main part of the candle is just a thin line, showing that neither buyers nor sellers could take control during the period.
- Shadows: The shadows can be long or short, showing how much price moved during the period despite the indecisive close.
- Location is Crucial: The Doji is only important when it appears after a clear trend.
- After an Uptrend: A Doji suggests the buying power is running out and a bearish reversal might be coming.
- After a Downtrend: A Doji suggests the selling power is running out and a bullish reversal might be coming.
- Types: The shape of the shadows can give more clues.
- Gravestone Doji: Looks like a "T" with a long upper shadow, a sign of a potential top.
- Dragonfly Doji: Looks like an upside-down "T" with a long lower shadow, a sign of a potential bottom.
- Needs Confirmation: A Doji is a warning sign, not a guarantee. You must wait to see what the next candle does to confirm the reversal. For example, a red candle after a Doji in an uptrend confirms the bearish signal.

The Real Trading Superpower?
Here’s to balance - the real edge most traders overlook.

Every trader eventually hits the wall.
Too cautious?
You miss the breakout.
Too aggressive?
You blow the account.
But the sweet spot - that delicate balance between being conservative and confidently stubborn - is where the real pros live.
Some days you need to protect capital.
Other days, you need to stick to your guns and trust the setup.
Either way, the market won’t hand you clarity - you’ve got to cultivate it within.
And whatever helps you stay grounded in that balance — routines, rules, mentors, even mistakes - go for it.
You need it.
Because that’s how you last.
That’s how you grow.
And for the trader trying to keep up?
He can keep up with us - as we deliver the market psychology that is so needed.
This week’s price action is wild.
But your mindset?
That’s what wins over time.


