Eightco All-Time Blast
....................................................................................................................


Good day, traders!
Wall Street’s treading water this Wednesday - futures flat as everyone waits for the data that could lock in the Fed’s next move.
A September cut still looks like a done deal, but one hot inflation print later this week could rattle that confidence fast.
Yesterday’s spotlight was all Apple.
The new lineup hit the stage, and now the question is whether consumers are ready to spend or if the shine is wearing off.
Traders are already weighing the impact on tech sentiment because if Apple can’t spark excitement, the Nasdaq may struggle to hold momentum.
So today we’re stuck in the middle: Apple buzz fading, inflation updates looming, and a market coiled tight.
Calm for now, but it won’t stay that way for long.

📈 Wall St. Creeps Up
iPhone 17 hype is here, but Wall Street’s not sure new AirPods can juice sales.
🚀 Eightco Explodes 5,600%
From $1.45 to $83 in hours—retail went max bull as traders piled into the madness.
🎬 This Blockbuster Stock Pops 35%
Three sessions, nonstop upper circuits—big money is jumping in.
💻 Tech Stocks Sparkle
Infosys, Coforge, and Wipro led a broad IT rebound as the index snapped a 5-day skid.
🏦 Fed Hope Lifts Stocks
Traders are shrugging off France’s mess, betting on a U.S. rate cut next week.
🐻 Kering Bears Circle
Short bets hit decade highs, piling pressure on new CEO Luca de Meo.
🪙 Gold Smashes Record
Spot hit $3,659 as traders bet big on Fed cuts and a softer dollar.

No stocks today. 📉
The market didn’t line up with any high-probability setups, so we’re staying flat for now.
We’ll stay patient and watch closely. I’ll update once a clean entry shows itself. ✅

Markets Look Complicated Until Someone Translates
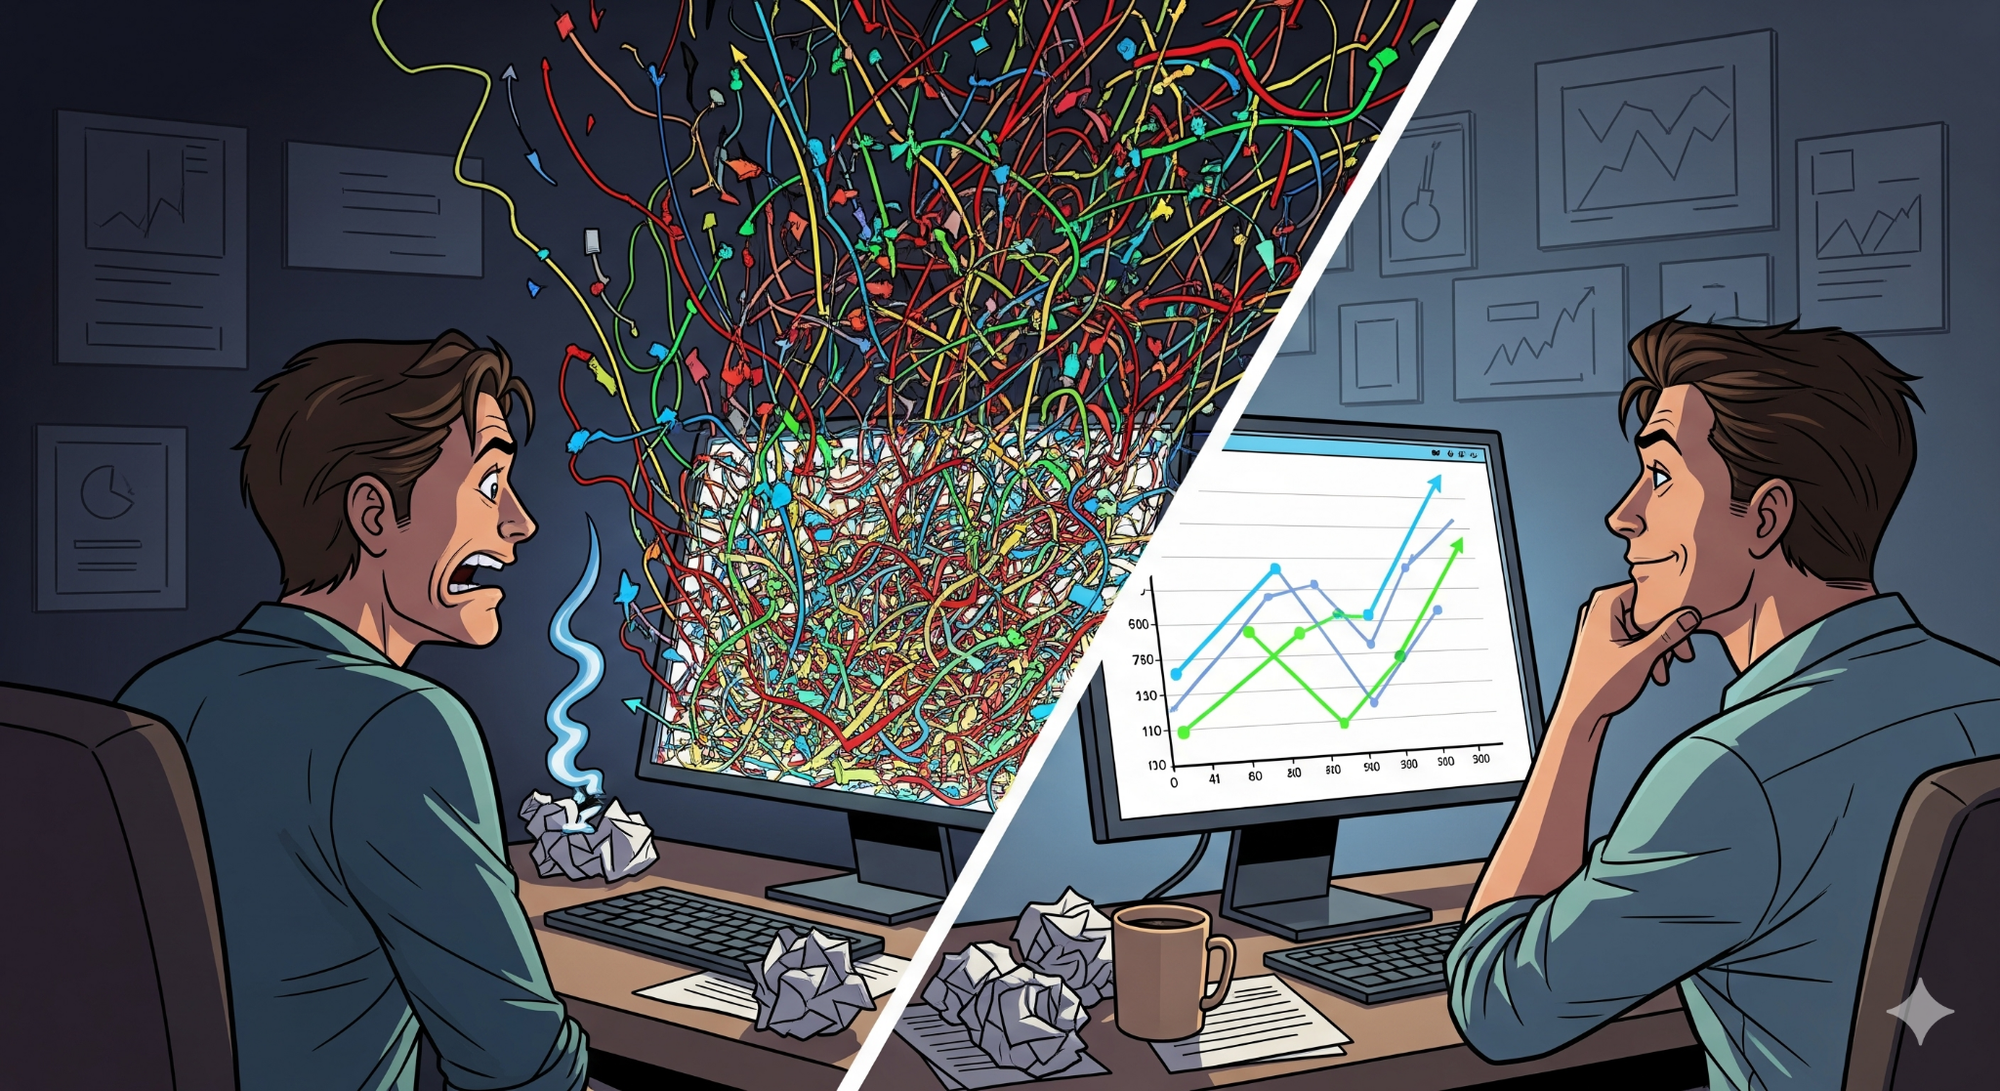
Open a trading chart for the first time and it looks like someone spilled spaghetti on your screen.
Lines, candles, indicators stacked on indicators - it’s enough to make anyone close the tab and walk away.
But here’s the thing: most of that noise isn’t needed.
Trading doesn’t start with twenty indicators and a PhD in finance. It starts with someone breaking it down in plain language so you can see what matters and ignore the rest.
That’s what trading newsletters do. They cut through the spaghetti mess.
They show you the signals worth watching and explain them in a way that clicks. No Wall Street jargon.
No charts that look like a coloring book. Just clarity you can act on.
👉 Yes, Markets look complicated until someone translates.
Start here!

Pring's Know Sure Thing (KST)
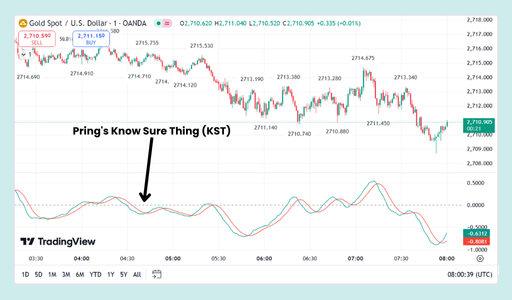
The Know Sure Thing (KST) is a momentum oscillator that measures the rate of change of a security's price across four different timeframes.
It was developed by Martin Pring to give traders a clearer and more comprehensive view of momentum than a single rate-of-change indicator.
It's designed to identify trends and potential reversals by combining and smoothing multiple price cycles into one signal.
What to Look For
- Zero Line: The KST oscillates above and below a zero line.
- Above Zero: Indicates bullish momentum, as the price is generally moving higher across the weighted timeframes.
- Below Zero: Indicates bearish momentum, as the price is generally moving lower.
- Crossover: A move above zero can signal a shift to a new uptrend, while a move below zero can signal a new downtrend.
- Signal Line Crossovers: The KST is typically plotted with a signal line, which is a moving average of the KST itself.
- Bullish Crossover: A buy signal occurs when the KST line crosses above its signal line, suggesting a strengthening of upward momentum.
- Bearish Crossover: A sell signal occurs when the KST line crosses below its signal line, suggesting a strengthening of downward momentum.
- Divergence (Key Signal): This is one of the most powerful signals.
- Bullish Divergence: If the price makes a new lower low, but the KST makes a higher low, it suggests that the selling momentum is weakening. This is a strong hint of a potential bullish reversal.
- Bearish Divergence: If the price makes a new higher high, but the KST makes a lower high, it suggests that the buying momentum is weakening. This is a strong hint of a potential bearish reversal.
- Trend Confirmation: The KST can confirm the strength of an existing trend. A rising KST line above zero confirms an uptrend, while a falling KST line below zero confirms a downtrend.

You Won’t Win Every Day
Some days the market will hand you green screens, other days it’ll humble you.
That’s just how this game works.
The sooner you stop expecting to win every single day, the faster your mindset shifts.
Losses aren’t a reflection of your skill.
They’re part of the math of trading.
Once you accept that, you stop chasing, stop forcing setups, and start focusing on protecting capital and waiting for your edge to appear.
Think about it: if you’re trying to win daily, you’ll burn out and overtrade.
But when you play the long game, those small red days don’t rattle you anymore.
They just become part of the cost of staying in the arena.
Make peace with losing days.
That acceptance is what separates traders who last from those who flame out.