
Disney Sneaks Higher
....................................................................................................................


Good Morning!
It’s Wednesday and the market’s handing out mixed signals again.
The U.S. Dollar can’t catch a break, it’s down nearly 11% this year, quietly bleeding value while traders chase risk elsewhere.
Some call it a slow-motion unwind, others say it’s setting up major plays in commodities, crypto, and global equities.
Either way, the dollar’s losing grip and money’s flowing fast into fresh opportunities.
One of those plays? Disney. The stock just hit levels we haven’t seen since 2002. Jefferies upgraded it to Buy with a $144 price target, and for anyone holding, that’s finally some serious green on the screen.
Even better: the share count isn’t growing that means leaner equity, cleaner upside, and less dilution risk.
As always, we’ve got the crucial updates on the trending trading news today - let’s dive in.

🚗 Tesla’s 60% Drop on Sweden and Denmark
Tesla sales dropped for a sixth straight month in Sweden and Denmark, underlining the challenges still facing the company, which is expected to report another fall in quarterly deliveries on Wednesday.
🎬 Disney Gets a Wall Street Plot Twist
Jefferies just upgraded Disney, citing four key catalysts from streaming to parks. After months of lagging the market, the bulls see momentum building.
🏦 Goldman Smashes Fed Stress Test — Stock Pops
Goldman Sachs crushed the Fed’s latest stress test, giving Wall Street confidence in its capital strength. Shares jumped as traders eye buybacks and dividend boosts - but does the rally have legs beyond the headlines?
🚘 China Auto Stocks Humiliate US Rivals
First-half numbers are out, and China’s automakers left US giants in the dust. Exports, EV dominance, and aggressive pricing fueled the surge with Beijing’s market now dictating the pace.
₿ Bitcoin Hits All-Time Monthly Close
Bitcoin just logged its highest monthly close ever, signaling major momentum as bullseye fresh price discovery.
🌍 Europe Rallies as Tariff Deadline Looms
European stocks opened strong despite looming tariff deadlines, with traders betting on last-minute diplomacy. But with tensions still simmering and market nerves running high, is this rally built to last?
🥇 Gold Gains on Dollar Weakness, Tariff Jitters
Gold prices climbed as a weaker dollar and tariff uncertainty fueled safe-haven demand.

McDonald’s Corp (NYSE: MCD) – TP Hit, Trade Closed
We caught McDonald’s right as it flipped from the pullback zone.
Price surged beautifully into TP1 at $298.53, and we locked it in.
2.31% gain before leverage.

A simple, clean move from demand straight into supply.
Exactly how a bounce setup should behave.
Adobe Inc. (NASDAQ: ADBE) – Closed Early, Off the Table
Now for Adobe - slightly different story.
The setup was valid, price was climbing, but as it approached mid-structure, the price started stalling.
Candles were getting smaller, momentum wasn’t as strong as we wanted, and the market overall looked shaky.
I made the call to close this trade earlier for a solid partial gain of 2.71% before leverage.
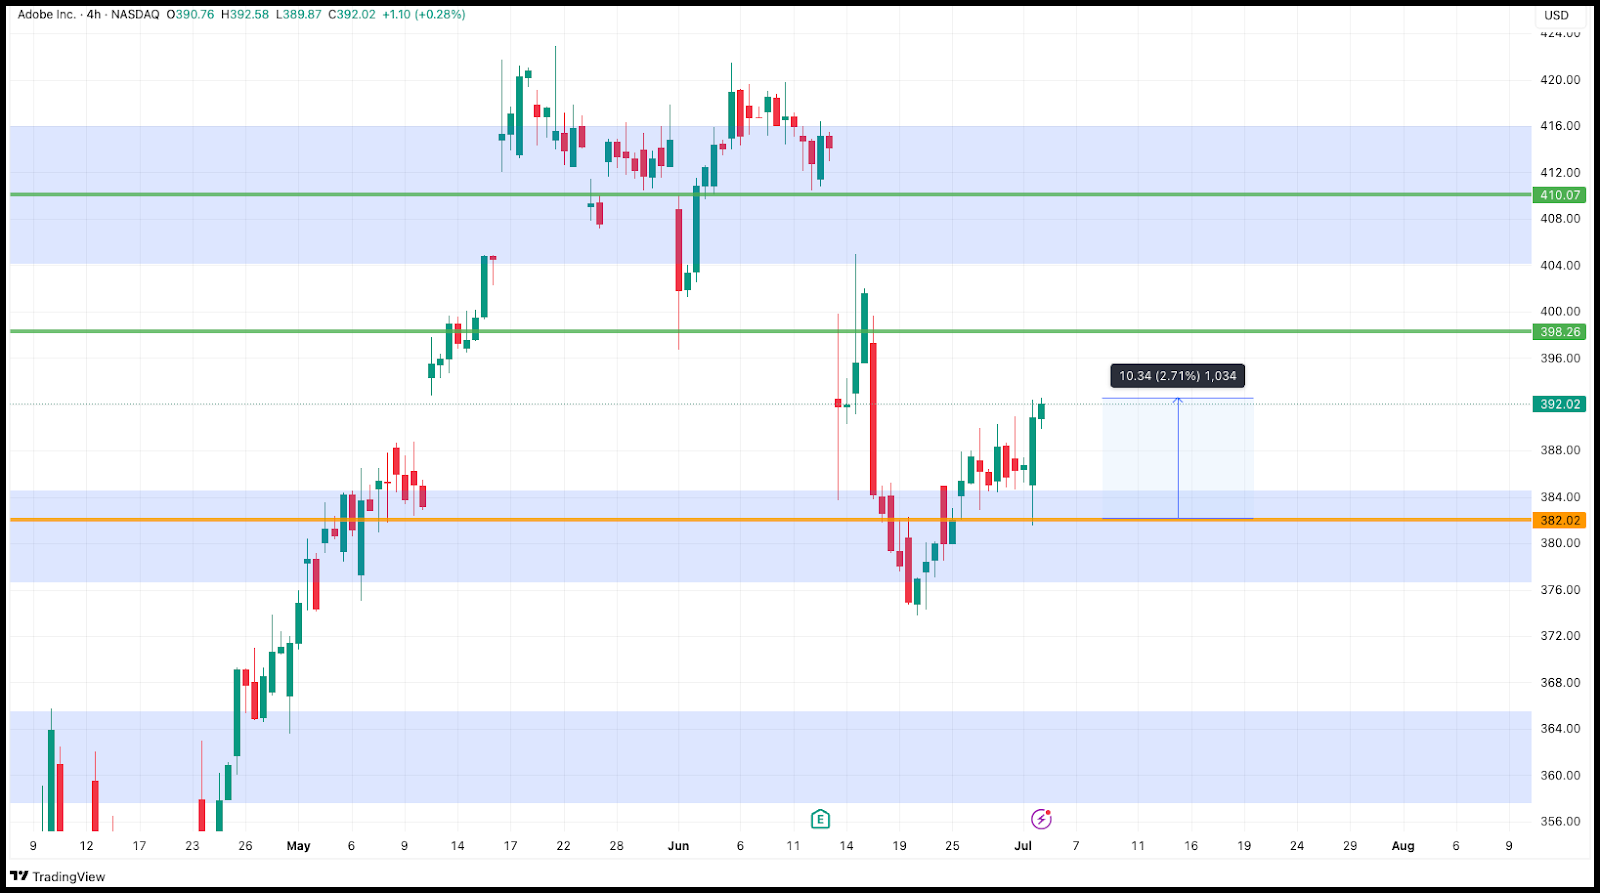
Sometimes, protecting the win is the smartest move in the game.
Profit in pocket.
Risk off the table. ✅

Trading Isn’t a Lottery Ticket - It’s a Skill You Build

If you’ve been secretly hoping your first few trades will magically double your account overnight… it’s time for a reset.
Trading isn’t about luck.
It’s not a scratch card, a slot machine, or a “one hit and I’m rich” story.
It’s a craft.
A game of patience, skill, and controlled risk.
But here’s the good news: once you start learning the right way, your expectations become grounded… and your results?
Way more consistent.
These curated newsletters don’t feed the hype.
They give you strategy, clarity, and calm.
So you stop jumping from dream to dream and actually build something real.
👉 If you’re tired of chasing miracles, these newsletters will give you the tools to trade with logic, not luck.

Ultimate Oscillator
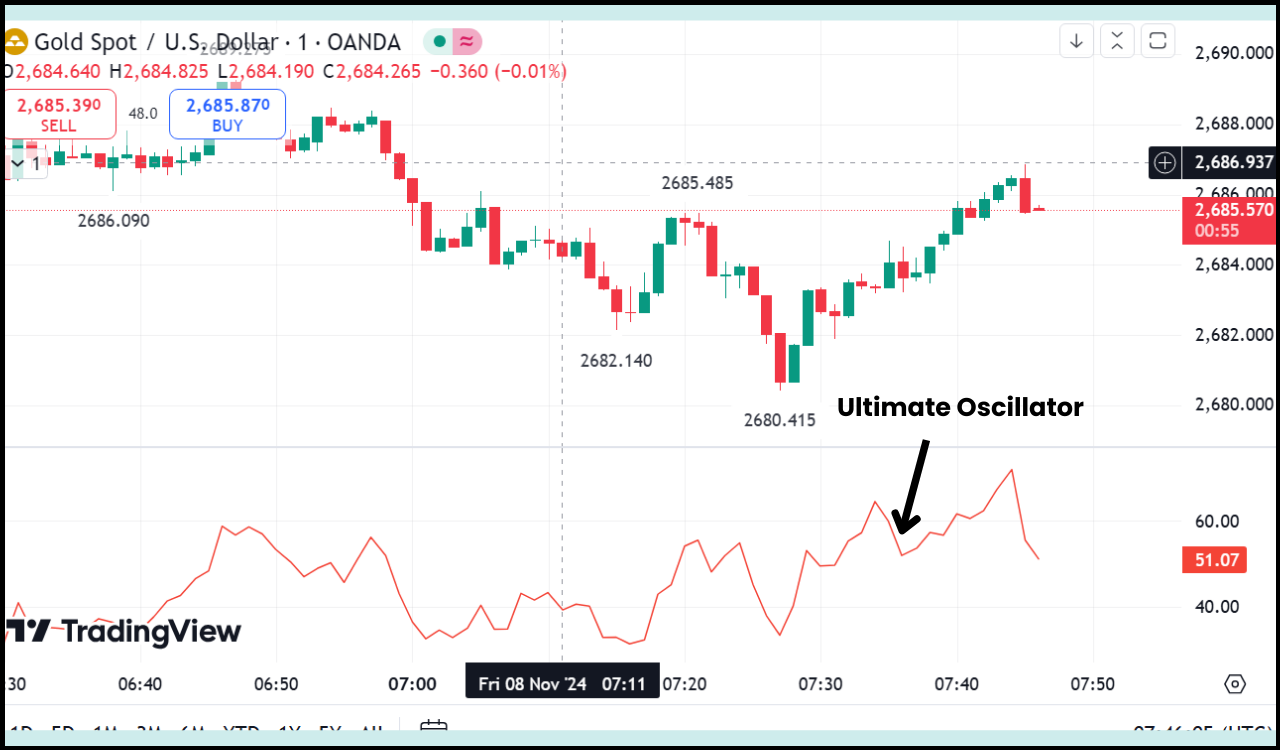
The Ultimate Oscillator is a momentum oscillator that measures buying and selling pressure across three different timeframes (short, medium, and long).
It was developed to avoid the flaws of other oscillators that give too much weight to recent price action, often leading to false divergences.
What to Look For:
- Oscillates Between 0 and 100: Like many oscillators, the Ultimate Oscillator typically ranges from 0 to 100.
- Overbought and Oversold Levels:
- Above 70: Generally considered overbought. This suggests buying pressure might be excessive, and a price correction or reversal could be near.
- Below 30: Generally considered oversold. This suggests selling pressure might be exhausted, and a price bounce or reversal could be near.
- Note: Unlike some oscillators, the Ultimate Oscillator is specifically designed to provide more reliable overbought/oversold signals by reducing whipsaws.
- Bullish Divergence (Key Signal):
- This is one of the most important signals. It occurs when the price makes a new lower low, but the Ultimate Oscillator makes a higher low. This suggests that despite falling prices, underlying buying pressure is building, hinting at a potential bullish reversal.
- This is one of the most important signals. It occurs when the price makes a new lower low, but the Ultimate Oscillator makes a higher low. This suggests that despite falling prices, underlying buying pressure is building, hinting at a potential bullish reversal.
- Bearish Divergence (Key Signal):
- Conversely, when the price makes a new higher high, but the Ultimate Oscillator makes a lower high, it suggests weakening buying pressure and potential selling interest, signaling a possible bearish reversal.
- Conversely, when the price makes a new higher high, but the Ultimate Oscillator makes a lower high, it suggests weakening buying pressure and potential selling interest, signaling a possible bearish reversal.
- Confirmation of Price Action:
- Trend Confirmation: A rising Ultimate Oscillator generally confirms an uptrend, while a falling oscillator confirms a downtrend.
- Breakouts: A strong move in the Ultimate Oscillator can confirm price breakouts from consolidation patterns.
- Three Timeframes: The calculation uses weighted averages from short (e.g., 7 periods), medium (e.g., 14 periods), and long (e.g., 28 periods) timeframes. This helps to smooth out the data and provide a more robust signal.

Midweek Wake-Up Call

Let’s cut the excuses - You knew better.
The moment you entered that trade without a stop-loss… Chased that candle out of FOMO… Or sized up because “this one looked different”…
Deep down, you knew.
And now?
You’re looking at the aftermath like the market did you dirty.
Nah. The market didn’t betray you.
You broke your own code.
And every time you do that, it costs you.
Not just money but confidence, clarity, and consistency.
So here’s your Wednesday reset: Stick to your rules. Respect your risk.
Because the market isn’t built to forgive; it’s built to expose.
Discipline is your edge. Use it.


