Deepseek Disrupts Wall Street
....................................................................................................................


Congratulations - you’ve officially survived the longest month of the year!
At least, that’s what January felt like.
But hey, we made it, and if you locked in some winning trades along the way, even better. 🥂
Now, onto today’s market action: Gold just surged past $2,800 last week, Bitcoin is battling to hold above $100K but hitting resistance, and XRP - along with other cryptos - took a weekend dip.
The yen is having its best January in seven years, and Apple’s stock is climbing after an upbeat sales outlook.
Let’s jump in - February is here, and the markets aren’t slowing down.

🐋 DeepSeek AI Shakes Up The Market!
DeepSeek's AI breakthrough has sent shockwaves through the tech world, sparking a market frenzy and raising concerns about US dominance in AI. While investors lost $600 billion in a single day, not everyone is buying into DeepSeek's revolution. Is this the dawn of a new AI era, or just another game of hype?
🔗 Gold Clips $2,800 for the First Time as the Run Higher Continues
As of January 31, 2025, gold prices have surged past the $2,800 mark for the first time, continuing their impressive upward trajectory. This rise is attributed to increased investor demand for safe-haven assets amid global economic uncertainties and potential trade escalations.
🔝 Gold Hits Record High Amid Inflation Concerns
Gold has reached a record high, driven by renewed inflation worries stemming from U.S. President Donald Trump's threatened trade tariffs. Investors are increasingly turning to gold as a hedge against inflation, leading to a significant uptick in demand and prices.
🟢 XRP and Bitcoin Rise Amid Market Recovery
Cryptocurrencies, including XRP and Bitcoin, have experienced a resurgence following recent market volatility. Bitcoin is trading at approximately $104,222.92, while XRP is priced at around $3.08 as at January 31.
🚀 Yen Set for Best January in Seven Years as Rates Path Diverge
The Japanese yen is on track for its strongest January performance in seven years, driven by divergent monetary policy paths between major economies. As of January 29, 2025, the USD/JPY exchange rate stands at 155.255.
📱 Apple Shares Rise After Positive Sales Outlook
Apple's stock has seen a notable increase, closing at $237.59 with an intraday high of $240.79. This rise is attributed to a positive sales outlook, signaling a potential recovery in iPhone demand.
📈 Oil Prices Rise Amid Inflation Concerns
Oil prices have rallied as investors express renewed concerns about potential inflation resulting from U.S. President Donald Trump's threatened trade tariffs.

Trump is certainly one of the most unpredictable presidents, and with him in office, we can expect a lot of volatility over the next four years.
The moment he announced tariffs on Mexico, Canada, and China, the market tanked immediately at the open.
Just take a look at the futures now (Asian timing).
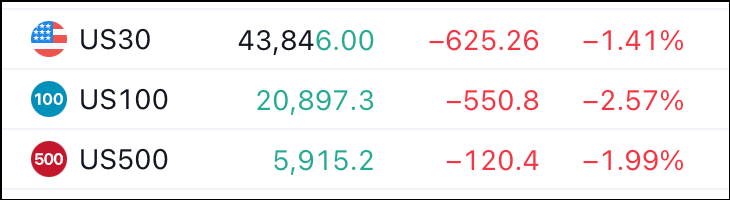
And do you know why I’m smiling right now?
Because we took two short positions last Friday, and now, the market is doing exactly what we anticipated.
Now, we simply let the market do its job.
When the market gaps down, finding strong long positions becomes much harder.
So for now, let’s focus on maximizing profits from the two stocks we shorted.
Let’s see how the market unfolds, and I’ll be back on Wednesday with my next winning stock recommendations! 🚀

Think Trading Will Burn Through Your Wallet Like a Fire Pit? Let’s Fireproof It!

Stepping into trading can feel like tossing your hard-earned cash into a bonfire - one wrong move, and it’s up in smoke.
That fear keeps a lot of people on the sidelines, convinced they’ll lose everything before they even get started.
But trading isn’t about blind luck - it’s about learning how to manage risk, protect your capital, and make smart, calculated moves.
That’s where these newsletters come in.
They break down proven risk management techniques, help you avoid costly beginner mistakes, and show you how to trade without reckless guesswork.
Whether it’s learning how to set stop-losses, understanding market trends, or knowing when to enter and exit a trade, these insights help you trade with confidence instead of fear.
The best part? You don’t have to figure it all out alone - these newsletters bring you expert strategies, so you can build your skills step by step.
Start trading with confidence and fireproof your wallet with these newsletters!

Vortex Indicator
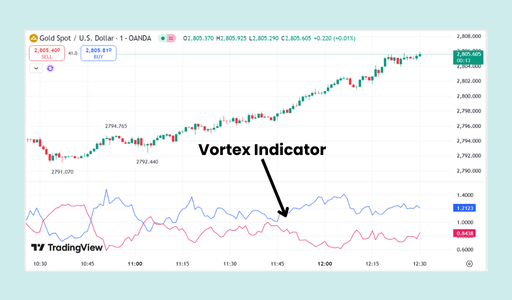
The Vortex Indicator is a technical analysis tool designed to identify the strength and direction of price trends.
It consists of two lines: VI+ (positive vortex) and VI- (negative vortex). These lines measure the strength of upward and downward price movements, respectively.
What to Look For:
- Trend Direction:
- When VI+ is above VI-, it suggests an uptrend.
- When VI- is above VI+, it suggests a downtrend.
- Trend Strength:
- The greater the distance between VI+ and VI-, the stronger the trend.
- The greater the distance between VI+ and VI-, the stronger the trend.
- Trend Reversals:
- A crossover of VI+ above VI- can signal a potential uptrend reversal.
- A crossover of VI- above VI+ can signal a potential downtrend reversal.

The Market Never Forgets - So Why Should You?

Ever taken a loss and, boom - your subconscious immediately tells you what went wrong?
“You chased that entry.” “Your stop was too tight.” “You ignored your plan.”
That’s not just frustration talking.
That’s experience knocking at your door.
But here’s the thing—most traders shrug it off and move on, hoping they’ll “remember next time.”
Spoiler: They won’t.
Top traders don’t leave lessons to chance.
They write them down. Every mistake. Every insight.
Every painful “I should’ve known better.”
Why?
Because the market is a brutal teacher - it keeps testing you until you learn.
Next time you take a loss, don’t just close the chart in frustration.
Grab a notebook, type a quick note in your phone - whatever it takes.
Track those patterns.
Study them.
Adapt.
Because the difference between a losing trader and a consistently profitable one isn’t intelligence - it’s the ability to learn from mistakes.
The market never forgets. Neither should you. 💡