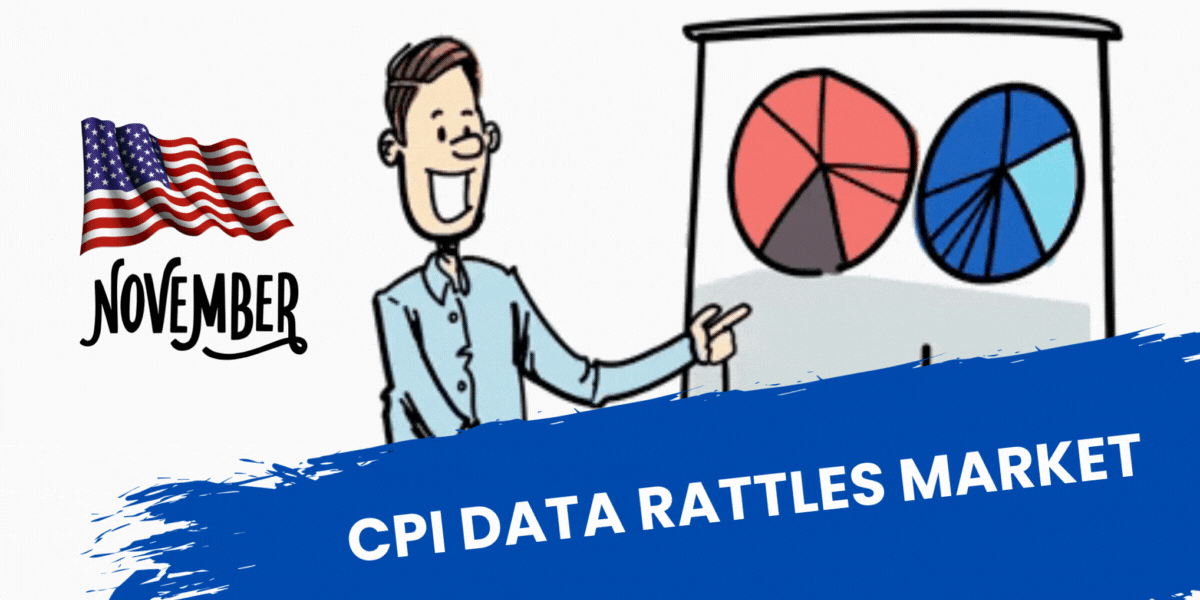
CPI Data Rattles Markets
....................................................................................................................


TGIF — and Wall Street is finally exhaling a little.
After a week that felt like a full month, futures are mixed but steadier this morning.
Cooling inflation and fading panic around the AI trade helped snap a recent losing streak, giving markets something to lean on as we head into the weekend. Thursday’s CPI report was the spark: prices cooled faster than expected, and traders were quick to price in friendlier rate-cut odds for next year — data quirks and all.
That relief is showing up most clearly in tech, where the Nasdaq is trying to hold onto yesterday’s momentum, while the Dow and S&P pause near the flatline. It’s not euphoria, but it’s progress.
Still, this week leaves scars. Major indexes are on track for weekly losses, December hasn’t delivered its usual holiday cheer, and stock rotation remains the theme under the surface. Today’s consumer sentiment data will be the final pulse check before markets clock out.
For now, the mood is simple: survive the week, take the win, and regroup.

📝 U.S. Inflation Data Sparks Debate — Experts Say Numbers Don’t Tell Full Story
November’s CPI showed a softer 2.7% annual rise, but economists warn the delayed, distorted report due to the federal shutdown makes it too unreliable to guide Fed policy — market reactions are cautious.
📈 Stocks Rally on Cooler Inflation Data, Micron Leads Tech Recovery
Major U.S. indexes snapped a four-day losing streak as softer-than-expected CPI and strong tech earnings boosted market confidence, even as traders brace for key earnings and Fed signals.
🤝 TikTok Strikes Deal to Shift U.S. Control
After years of political turmoil, ByteDance has agreed to restructure TikTok’s U.S. business under a U.S.-based joint venture, potentially averting a looming ban and ensuring continued access for millions of Americans.
⬆️ Bitcoin Rebounds on Japan Rate Hike, Analysts See Big Moves Ahead
BTC climbed as markets reacted to the Bank of Japan’s rate increase, with some analysts even forecasting long-term upside despite short-term volatility.
💥 Friday Could Be a Wild Trading Day on Wall Street
Traders face a potentially volatile day as inflation figures, Nike and FedEx earnings, and central bank cues converge to shape year-end market direction.
👟 Nike Beats Q2 Expectations but Stock Sinks on Weak China Demand
Despite surpassing forecasts, Nike’s earnings report triggered a sell-off as slowing sales in key markets weighed on investor sentiment.
📦 FedEx Stock Jumps After Strong Earnings
FedEx delivered stronger-than-expected results and lifted its full-year outlook, driving shares higher as cost-cuts and demand strength boost confidence.

Experts Weren’t Born Profitable
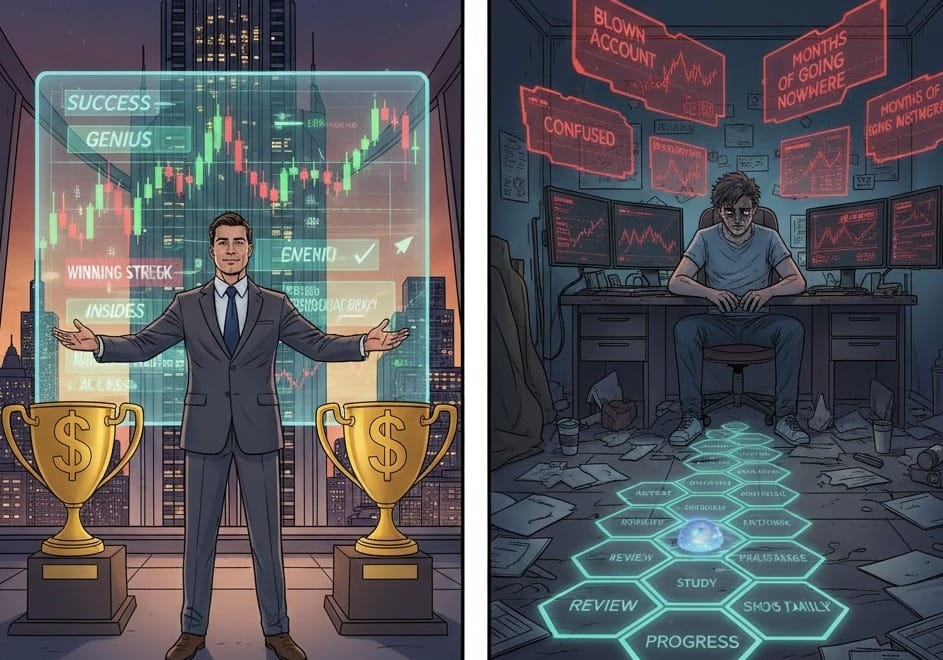
Every trader you admire started out confused, inconsistent, and wrong more times than they want to admit. You just didn’t see that part. You saw the highlight reel, not the blown accounts, bad entries, or months of going nowhere.
Comparing yourself to experts skips the most important step: learning. Skill in trading is built through repetition, review, and patience. Not talent. Not luck. Not having inside access. Progress comes from showing up, making mistakes, and fixing them one decision at a time.
You don’t need to be exceptional to begin. You just need to be willing to practice without judging yourself against someone else’s finish line.
If you want steady guidance that helps you learn without pressure or comparison, these newsletters are a solid place to start. They focus on understanding the market, not pretending you’re already a pro.

Money Flow Index (MFI)
The Money Flow Index (MFI) is a momentum oscillator that measures the inflow and outflow of money into an asset over a specific period (typically 14 periods).
While it is visually similar to the Relative Strength Index (RSI), the MFI is often called the "Volume-Weighted RSI" because it incorporates both price and volume data, whereas the RSI only uses price.
By factoring in volume, the MFI provides a deeper look at the conviction behind price moves, making it a "leading" indicator that can often spot potential reversals before they appear in the price action alone.
What to Look For (Key Features and Signals)
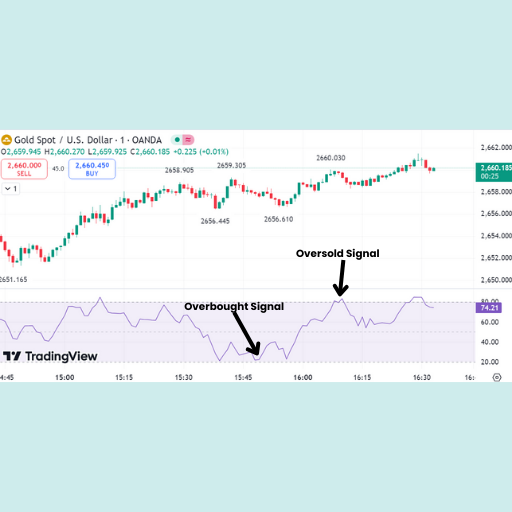
The MFI fluctuates on a scale from 0 to 100. Its signals are interpreted based on how the oscillator moves through specific zones.
- Typical Price and Raw Money Flow: The calculation starts with the Typical Price (High + Low + Close divided by 3). This is multiplied by volume to get the Raw Money Flow. If the Typical Price is higher than the previous period, the flow is positive; if lower, it is negative.
- Overbought and Oversold Levels:
- Overbought (Above 80): A reading above 80 indicates that buying pressure is reaching extreme levels and the asset may be due for a downward correction.
- Oversold (Below 20): A reading below 20 indicates that selling pressure is exhausted and the asset may be poised for an upward bounce.
- Divergence (The Most Powerful Signal): When price and MFI disagree, it often signals an impending trend reversal.
- Bearish Divergence: Price hits a higher high, but the MFI makes a lower high. This suggests that despite the rising price, the volume supporting the move is decreasing.
- Bullish Divergence: Price hits a lower low, but the MFI makes a higher low. This suggests that selling volume is drying up even as prices fall.
- Failure Swings: These occur when the MFI enters an extreme zone, crosses back out, and then fails to re-enter that zone on the next price swing.
- Trend Confirmation: An MFI crossing the 50 centerline can confirm trend direction. A move above 50 suggests bullish momentum is taking control, while a drop below 50 suggests bearish momentum is dominant.

Mental Fatigue Disguised as Discipline

There is a subtle trap traders fall into when they are exhausted. They call it discipline.
You notice it when your rules suddenly become rigid.
You pass on clean setups. You hesitate longer than usual.
You tell yourself you are being “extra careful.”
But underneath that caution is not clarity. It is fatigue.
When the mind is tired, it looks for safety, not opportunity.
Stricter rules feel like control.
In reality, they are a shield.
A way to avoid decision making when your mental energy is low.
True discipline comes from clarity and consistency.
It feels calm. It feels intentional.
You know why you are waiting, and you know exactly what you are waiting for.
Fatigue based discipline feels heavy.
Second guessing increases.
Confidence quietly drains.
Every click feels risky.
This is not a mindset problem. It is an energy problem.
The market does not reward pushing through mental exhaustion.
It punishes it.
Sometimes the most professional decision is to step away.
Rest is not weakness.
It is maintenance.
Protect your mental capital the same way you protect your account.
When your mind is sharp, discipline flows naturally.
When it is drained, even the best rules will feel like chains