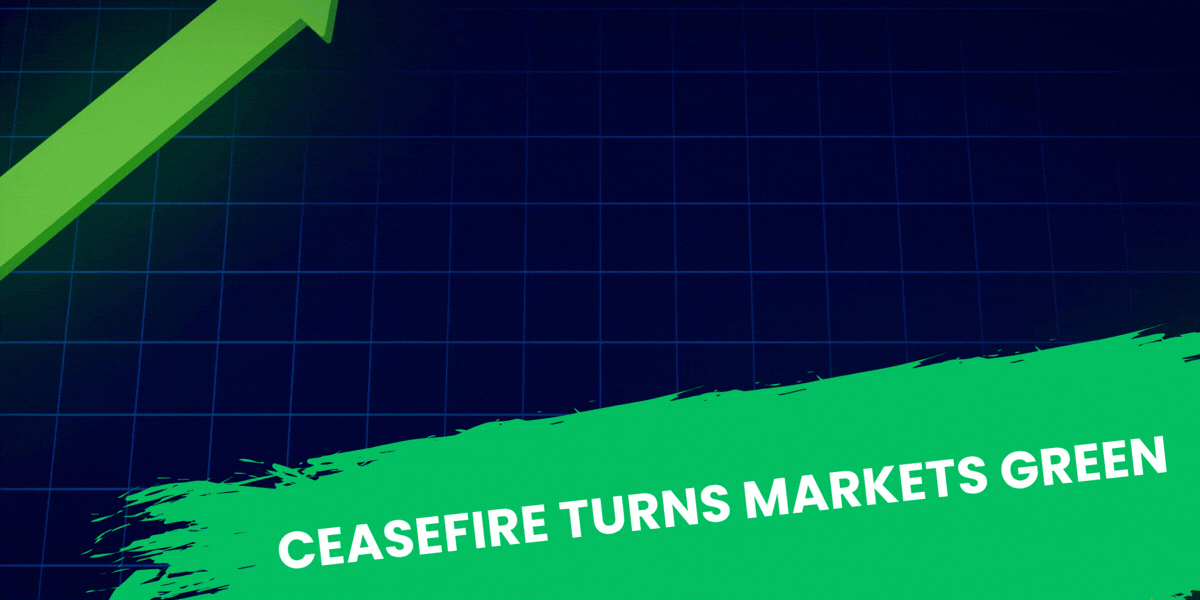
Ceasefire Turns Markets Green
....................................................................................................................


Good morning.
The market just got the "miracle" it was looking for.
After weeks of staring down the barrel of a global energy crisis, we are seeing a massive, adrenaline-fueled explosion in green this Wednesday. The Nasdaq is up a staggering 3.5%, while the Dow has leaped over 1,000 points in pre-market trading. It’s like the entire financial world just exhaled at the exact same time.
The "supply heart attack" finally has a cure. Just hours before a massive bombing campaign was set to begin, President Trump and Tehran agreed to a two-week "double-sided" ceasefire. The best part? The Strait of Hormuz is reopening. The reaction in the oil pits was instant and violent: Brent crude cratered nearly 14% to $94, while WTI dove 16%. For a market that was pricing in $130 oil and permanent war, this is a total game-changer.
The Fed’s "sticky inflation" excuse just evaporated. With oil prices in freefall, the odds of interest-rate cuts being back on the table for 2026 are skyrocketing. We’ll get a peek behind the curtain today with the release of the Fed’s March meeting minutes, but the real story is that the "higher for longer" narrative just lost its biggest tailwind.
Delta Air Lines is the first real test of the "war scar" era. They report earnings this morning, and everyone is watching to see how badly those fuel spikes and flight cancellations bruised the bottom line. But with jet fuel prices now plunging alongside crude, even a messy report might get a pass from investors looking toward the recovery.
It’s a "risk-on" Wednesday for the history books. The "war fog" isn't totally gone, but for the next two weeks, the bulls are back in the driver’s seat.

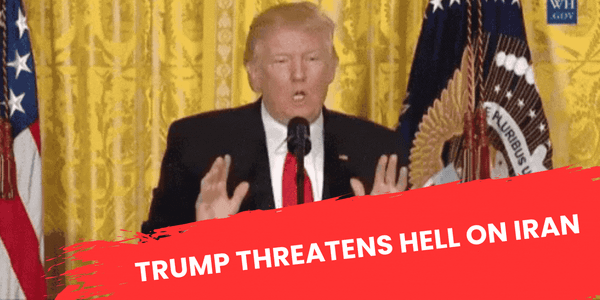
🚀 Dow Futures Skyrocket 1,000+ Points on Two-Week Ceasefire
U.S. stock futures exploded higher Wednesday after President Trump suspended planned attacks on Iran just hours before his "Power Plant Day" deadline. Dow futures jumped 1,056 points (+2.25%) and the Nasdaq climbed 3.2% as a two-week truce paused the five-week conflict that had crippled global markets.
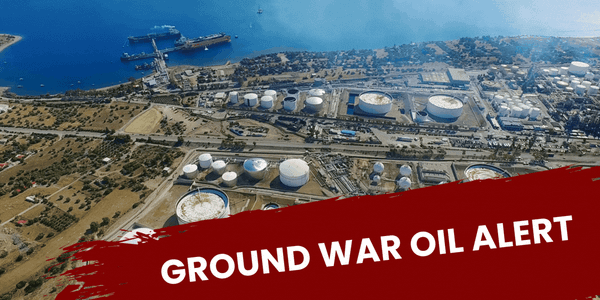
🛢️ Oil Plunges Below $100 as Hormuz Reopening Nears
Crude prices collapsed in early trade as the ceasefire hinged on the "complete and immediate" opening of the Strait of Hormuz. With Iran signaling that safe passage is "possible" during the two-week window, the global energy supply risk premium vanished, sending Brent and WTI tumbling.
🇰🇷 SK Hynix Surges 15% on Samsung’s Blowout Earnings
South Korean chipmakers led a massive regional rally after Samsung projected an eight-fold jump in operating profit. SK Hynix shares soared 15%, fueled by insatiable AI infrastructure demand that has stretched supplies and driven semiconductor prices to record levels.
🥇 Gold Hits $4,850 as Investors Hedge Ceasefire Risks
Despite the relief rally in stocks, bullion surged 3.2% to top $4,850 an ounce as traders remained cautious about the truce's fragility. The metal’s resilience indicates that while immediate war fears have eased, the market is still pricing in significant long-term uncertainty.
₿ Bitcoin Surges Past $72K as Risk Appetite Returns
Bitcoin rocketed above $72,000, gaining $3,000 in a single hour as the ceasefire triggered a "dash for risk." The crypto market’s rapid recovery mirrors the broad rebound in equities, as liquidations reversed and institutional sentiment turned sharply bullish.
📊 Treasury Yields Plunge as Investors Pile Into Bonds
The 10-year U.S. Treasury yield plummeted over 10 basis points to 4.23% as the ceasefire deal lifted global sentiment. Shorter-dated yields also saw a massive retreat, with the 2-year note falling 11 basis points as the immediate threat of war-driven hyperinflation cooled.
🌏 Asia Markets Rally as South Korea Leads Gains
Indices across the Asia-Pacific closed sharply higher Wednesday, following the de-escalation signals from Washington. South Korea’s Kospi was the standout performer, buoyed by the historic surge in heavyweight chip stocks and the prospect of normalized regional trade.

Pressure Makes Good Traders Break Their Own Rule
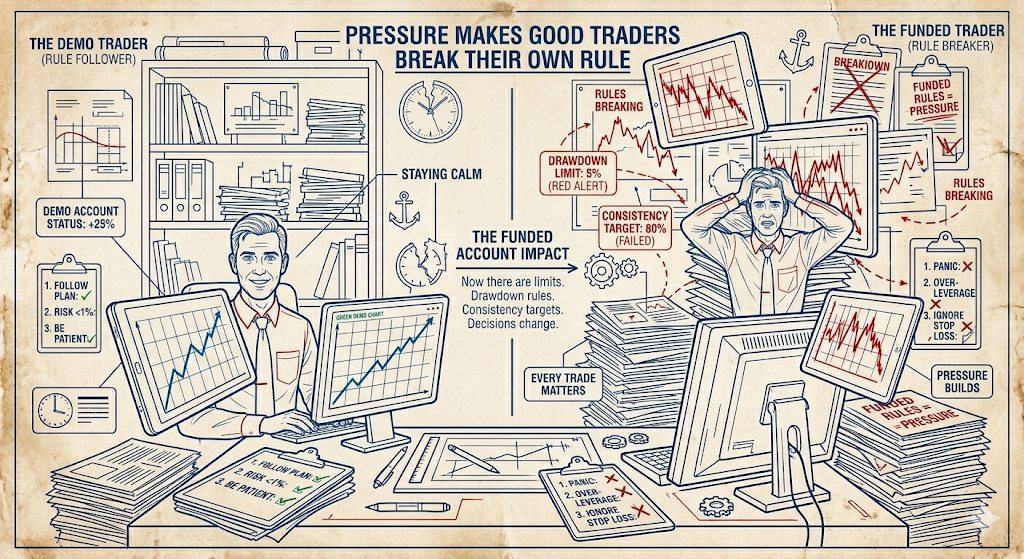
You trade well on demo. You follow your plan. You stay calm.
Then you get a funded account… and everything changes.
Now there are limits. Drawdown rules. Consistency targets. Every trade feels like it matters more. The pressure builds quietly.
That’s where decisions start to change.
You hesitate on good setups. You close trades too early. Or you force trades trying to “make something happen.” The same strategy suddenly feels harder to execute.
It’s not the system that changed. It’s the pressure.
Strong traders treat funded accounts the same way they treat practice. They keep position sizes consistent. They focus on execution, not outcomes. They respect the rules without letting them control their emotions.
When you manage pressure, your performance stabilizes. You stop reacting to the account and start following your process again.
Some traders like learning how others handle pressure and stay consistent in different environments.
If that’s you, you can explore a few market reads here:

Bearish Kicker
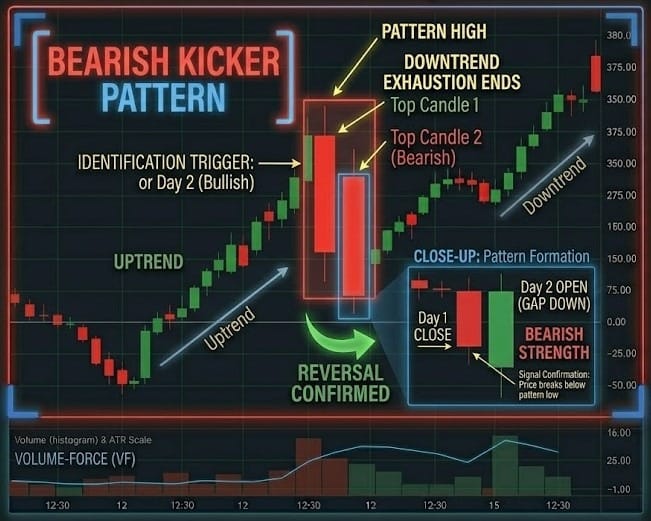
The Bearish Kicker is the violent mirror image of the Bullish Kicker and is considered one of the most reliable reversal patterns in existence. It occurs when a sharp uptrend is instantaneously deleted by a massive gap down. The first candle is a long green candle, and the second is a long red candle that opens below the previous day’s open. This pattern represents a total "shock" to the system, usually triggered by catastrophic news or a massive institutional sell-off.
🛠️ The Strategy Logic
Use these logical triggers to identify when a "Bull Trap" has been sprung and a crash is beginning:
- IF: The second (red) candle opens below the opening price of the first (green) candle...
- THEN: The pattern is a valid Bearish Kicker. The "Gap" has completely bypassed the previous day's trading range, leaving every single person who bought yesterday at an immediate loss.
- THEN: The pattern is a valid Bearish Kicker. The "Gap" has completely bypassed the previous day's trading range, leaving every single person who bought yesterday at an immediate loss.
- IF: The second (red) candle has little to no upper wick (Bearish Marubozu)...
- THEN: The conviction is maximum. It shows that from the moment the opening bell rang, sellers were in absolute control and never allowed the price to bounce back toward the gap.
- THEN: The conviction is maximum. It shows that from the moment the opening bell rang, sellers were in absolute control and never allowed the price to bounce back toward the gap.
- IF: The Bearish Kicker appears at a multi-month high or near the Upper Keltner Channel...
- THEN: This is a "Structural Top." It isn't just a pullback; it is a regime change. The "upward" trend has been broken with such force that a long-term downtrend is the most likely outcome.
- THEN: This is a "Structural Top." It isn't just a pullback; it is a regime change. The "upward" trend has been broken with such force that a long-term downtrend is the most likely outcome.
- IF: The Volume Oscillator shows a massive spike on the "Kicker" (red) day...
- THEN: The move is backed by "Smart Money." Huge volume on a gap-down confirms that large funds are exiting their positions, making the downward move very difficult to reverse.
- THEN: The move is backed by "Smart Money." Huge volume on a gap-down confirms that large funds are exiting their positions, making the downward move very difficult to reverse.
- IF: The price fails to rally back into the "Gap" zone within the next 3 candles...
- THEN: The bearish trend is confirmed. The gap now acts as a "Ceiling of Glass"—it is a zone of heavy supply that will likely reject any future attempts to rally.
💡 Pro Tip
The "Death Gap" Rule: In many patterns, traders expect a "gap fill," but a true Bearish Kicker is a Breakaway Gap. If the price actually manages to rally back and fill the gap, the Kicker's power is neutralized.
Do not wait for a bounce to enter. The most aggressive (and often most profitable) entry is at the close of the red Kicker candle, with a stop-loss placed at the midpoint of the first (green) candle.
If the bears are truly "kicking," the price should stay below that midpoint and continue to slide.

When Life Leaks Into Your Trades
You sit down to trade.
Charts are clean.
Plan is clear.
Nothing looks different on the surface.
But something is different.
A stressful morning.
An argument.
Pressure from work.
Something unresolved in the back of your mind.
You tell yourself it won’t affect your trading.
Then the session starts.
First trade — you hesitate.
Second trade — you size up.
Third trade — you rush the entry.
Same market.
Different behavior.
WHAT HAPPENS OUTSIDE THE MARKET DOESN’T STAY OUTSIDE.
It leaks.
Not always in obvious ways.
Sometimes it shows up as over-aggression.
You increase size to “feel in control.”
You push trades harder than usual.
Other times it shows up as fear.
You cut winners early.
You skip valid setups.
You second-guess everything.
Either way, your decision-making is no longer neutral.
YOUR EMOTIONAL STATE IS NOW PART OF YOUR RISK MODEL.
And that’s dangerous.
Because your system was built for a stable mindset, not a distracted or stressed one.
Professionals respect this.
They don’t just assess the market.
They assess themselves.
Am I focused?
Am I calm?
Am I clear enough to execute?
If the answer is no, they adjust.
Smaller size.
Fewer trades.
Or no trading at all.
Because protecting capital isn’t just about stop losses.
It’s about knowing when you are not in the right state to perform.
Let’s be honest:
You can’t always control what happens in your personal life.
But you can control how much it impacts your trading.
So here’s the shift:
Before you look at the charts, check your state.
Because the biggest risk on some days isn’t the market.
It’s the version of you showing up to trade.