Bullish on Shopping Stocks
....................................................................................................................


Good morning!
Wall Street is opening under the weight of Washington’s first shutdown in seven years, with futures sliding as traders brace for delayed data and political crossfire.
But even with DC in gridlock, shopping stocks are stealing the spotlight.
OpenAI just turned ChatGPT into a checkout machine, sparking a retail frenzy that sent Etsy and Shopify soaring. Bulls are piling in, shorts are circling, and sentiment on Stocktwits is boiling over with traders calling this the next big wave.
Shutdown fears may be rattling markets, but right now the street is bullish on shopping stocks.
Let’s break it down.

🪙 Gold Smashes Record as Shutdown Fears Spark Haven Stampede
Bullion hits $3,867 as Washington gridlock fuels safe-haven demand and clouds the Fed’s next move. With a 47% YTD surge, traders wonder how long the rally can run before data blackouts bite.
🤖 OpenAI’s Growth Rocket Faces Cash Burn Countdown
Investors see surging sales, swelling war chests, and a $500B valuation talk. But with billions torched to power ChatGPT, the question is whether revenue can outpace the flames.
🛍️ Etsy and Shopify Soar as ChatGPT Opens Instant Checkout
OpenAI just turned its chatbot into a mall, and retail sentiment is boiling over on Stocktwits. Bulls see endless upside, while shorts eye Etsy’s 19% short interest as fuel for fireworks.
🐂 Apple Bulls Eye $310 on iPhone 17 Frenzy
Wedbush hikes its target as record-breaking demand powers the stock 26% higher in three months. With 315M devices due for upgrade, could 2025 be Apple’s supercycle moment?
↕️ Markets Flat as Shutdown Clouds Jobs Data, Nike Earnings on Deck
Futures trade sideways with Washington gridlock threatening key reports and payrolls. Traders brace for Fed speeches, consumer confidence, and JOLTS while watching crude slump and gold hit records.
💵 Can the Dollar Hold After Its Best Run in Months?
Shutdown risk, shaky labor signals, and looming payrolls weigh on momentum. Analysts warn history shows a dip first, rebound later — but volatility is back in FX
📉 Europe Stocks Slip, Pandora Leads Losers After CEO Exit
Stoxx 600 drifts lower with tariffs, shutdown risks, and weak labor signals in focus. Pandora’s 3.5% slide after its CEO retirement adds fresh weight to a shaky open.

Still no fresh setups today.
But don’t mistake this for inaction.
I’m still spending time sharpening the blade.
Refining our sniping so that when the right stock walks into range, we’re ready to fire with precision.
We’re close. Be patient.
When the next move comes, you’ll see why the wait was worth it.

If You’re Trading From Fear, You’ve Already Lost
Fear has a way of hijacking decisions.
When you see others winning and feel the urge to jump in just to avoid missing out, you stop thinking like a trader and start acting like a panicked follower.
That’s when mistakes pile up.
Good trading doesn’t come from rushing after every move. It comes from waiting for setups that fit your plan, not your emotions.
Markets will always offer another opportunity. Your edge is knowing when to sit tight.
Cut the FOMO before it cuts your account.
👉 Get trading newsletters that keep you grounded with clear insights instead of hype

Double Top
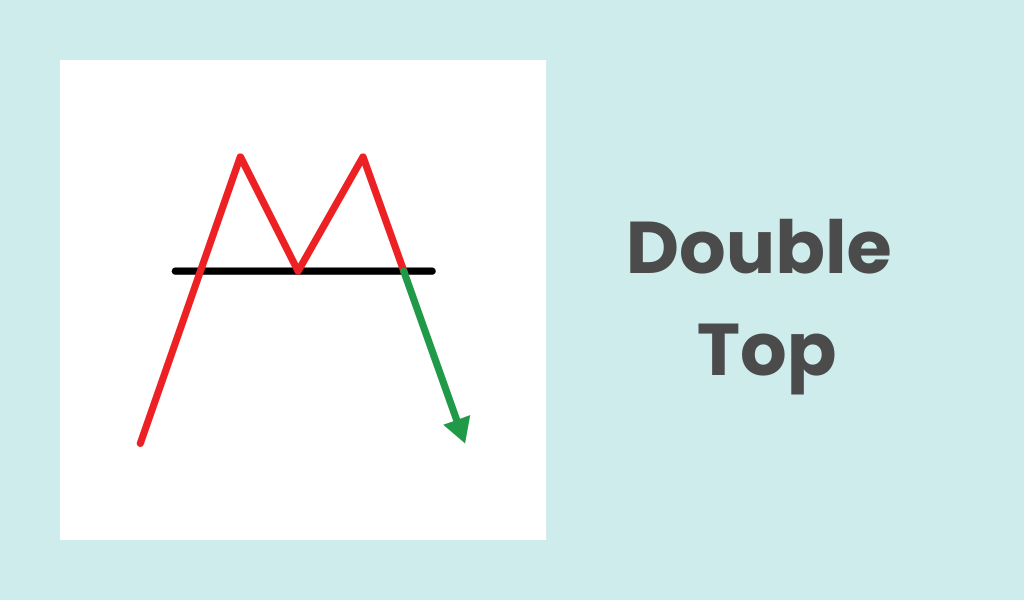
The Double Top is a powerful and easy-to-spot bearish reversal pattern that appears on price charts after a clear uptrend. It signals that the buying pressure (bulls) is likely exhausted and a shift to a downtrend (bears) is imminent.
The pattern looks like the letter "M" and is formed because the price attempts to break a resistance level twice but fails, indicating that the market is struggling to move higher.
Its three key features are:
- First Peak (Top 1): Price reaches a high and then pulls back.
- Trough/Neckline: The low point reached after the first peak. This is the crucial support level.
- Second Peak (Top 2): Price rallies again to a level approximately equal to the first peak, but then falls again.
What to Look For
1. The Pre-Existing Trend
- The pattern must be preceded by a distinct uptrend. A Double Top cannot exist in a sideways or downward-trending market.
2. The Two Peaks (Tops)
- Look for two distinct peaks that are at approximately the same price level. Minor variations are acceptable, but they should be close enough to signal repeated failure at a resistance level.
- The time between the two peaks can vary, but a longer duration (more time between the tops) generally suggests a more significant and reliable pattern.
3. The Neckline (Confirmation Level)
- The Neckline is the horizontal support line drawn across the low point (the trough) between the two peaks.
- This is the most critical level. The Double Top pattern is NOT confirmed until the price breaks below the Neckline.
4. The Confirmation Signal (The Breakdown)
- The official signal is the moment the price closes clearly below the Neckline. This breakdown signifies the reversal is likely underway and is the typical entry point for a short (sell) trade.
- Volume can help confirm the signal: Look for low or decreasing volume as the price forms the second peak, followed by a noticeable increase in volume as the price breaks below the Neckline.

🎯 Price Is Just the Messenger
The market is an auction, and price is only the tool it uses to test where buyers and sellers agree on value.
If you mistake price for truth, you’ll get trapped chasing noise.
The real skill is spotting value zones where conviction builds.
Here’s how you can start doing that today:
1. Mark key areas of acceptance. Look for zones where price spends the most time or trades the heaviest volume. That’s where the market is telling you value exists.
2. Spot rejection. Sharp, fast moves away from a level? That’s rejection, and it signals value is not there. Don’t fight it - follow it.
3. Plan around auctions, not ticks. Instead of reacting to every candle, wait for price to revisit or reject a value area. That’s your trade location.
4. Use price as a tool, not gospel. Price is just a probe. Focus on what the market is trying to do (find value) rather than what the last print says.
5. Anchor your discipline. Your edge is waiting for setups around value, not chasing spikes. Make patience part of your plan.
👉 Next time you open your chart, don’t just ask “where is price?”- ask “where is value?”
That’s where the profits hide.