
BTC Selloff Returns
....................................................................................................................


December is here — but instead of stepping into the month with a victory lap,
Wall Street is already tripping over its shoelaces. US stock futures opened the week in full retreat, with the Dow down 0.5%, the S&P slipping 0.6%, and the Nasdaq sliding almost 0.8%. After a huge Thanksgiving rebound, the market looks like it’s hitting its first December speed bump.
Ironically, this is supposed to be one of the market’s friendliest months of the year. But 2024 has rewritten every seasonal script, and analysts aren’t betting on a classic Santa Claus rally. Even the pros are shrugging: “None have behaved the way they have seasonally,” RBC’s Amy Wu Silverman said and honestly, she’s right.
Last week’s surge was powered by rate-cut optimism, with markets giving an 85% chance the Fed trims rates next week. Adding to the suspense, President Trump casually dropped that he’s already chosen Jerome Powell’s potential replacement — but didn’t bother naming names. Classic market suspense.
And in consumer news, Cyber Monday is shaping up to break spending records, with U.S. shoppers expected to pour $14 billion+ into online sales proving that even economic uncertainty can’t slow holiday shopping mania. Deals on electronics and apparel are peaking, keeping people glued to their screens and reminding markets just how much consumer behavior matters this season.
In crypto? Bitcoin is starting December on the wrong foot too, tumbling below $87,000 as selling pressure refuses to let up.
Buckle up — if the first trading day looks like this, December is already gearing up to be anything but predictable.

🔮 Wall Street Bulls See S&P 500 at 8,000 by 2026
In its 2026 outlook, Deutsche Bank projected the S&P 500 could climb as high as 8,000, driven by an AI‑fuelled earnings surge, big buybacks, and looser Fed policy — the boldest upside forecast in recent memory.
💰 BoFA Puts Nvidia, Palantir, Robinhood on Top Buy List
With confidence high in an AI‑driven bull market, Bank of America flagged Nvidia, Palantir Technologies and Robinhood Markets among its top picks — signaling big money is still hunting upside in tech.
🟡 Gold Hits Two‑Week High on Rate‑Cut Optimism
Spot gold surged as safe‑haven buyers return — buoyed by rising odds the Fed might trim rates, pushing bullion to fresh two‑week highs.
6️⃣ Goldman’s Favorite 6 Stocks That Funds Are Loading Up On
According to one leading analyst house, six under‑the‑radar stocks are now top picks among hedge funds and mutual funds — a telltale sign big investors are preparing for the next leg up.
📈 SMX Soars 220% Today — What’s Fueling the Jump?
A sudden 220 % spike in SMX put it on traders’ radars overnight — fueled by bullish speculation around its molecular‑tech prospects.
📉 Bitcoin Tanks to US$85K — Traders Eye December Low
With Bitcoin slipping toward US$85,000, some traders are bracing for a deeper drop by December, citing fading momentum and macro uncertainty.
💥ZEC Crashes After US$21.6 M of Longs Liquidated
Ethereum‑adjacent crypto Zcash (ZEC) plunged sharply after more than US$21.6 million in long positions were liquidated.

Trading Isn’t a Robot Race, It’s a System Race
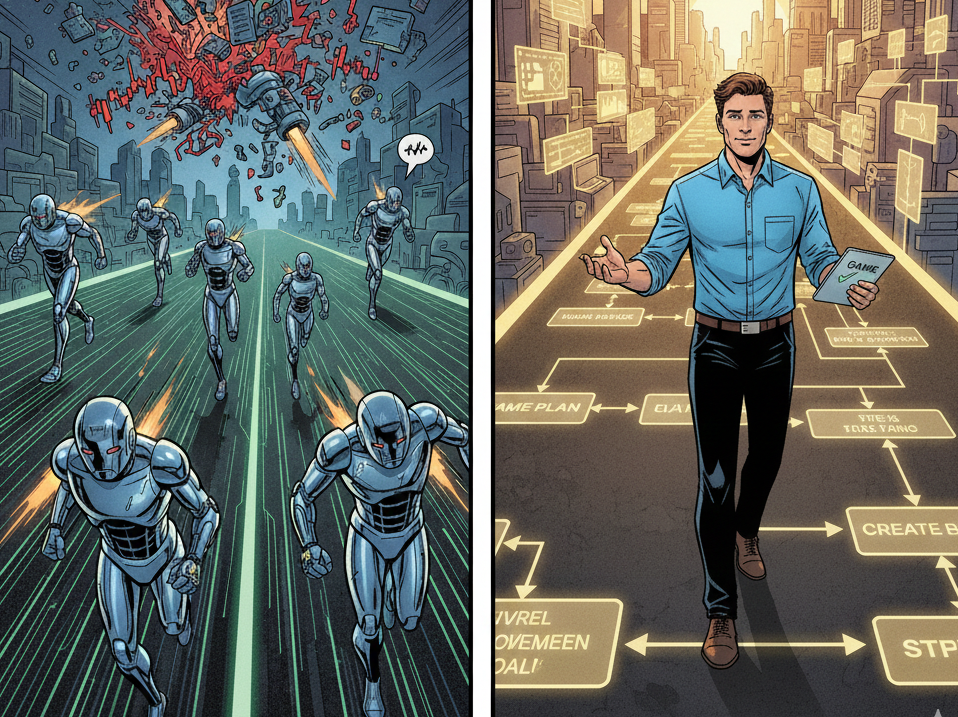
Many traders hesitate because they think they’re competing with bots. Fast algorithms. AI indicators. Automated systems that seem untouchable. That fear makes trading feel unfair and impossible.
The truth is simple: success doesn’t come from speed. It comes from a repeatable system. Bots follow rules - they don’t adapt, they don’t think, they don’t manage risk like a disciplined trader.
When you build a process that works for your goals, you don’t compete with machines. You compete with the market—and you can win.
Trading becomes less intimidating when you focus on structure instead of speed. You plan, you execute, and your edge comes from consistency, not code.
If you want guidance on building a system that keeps you ahead without relying on luck, these newsletters help. They break down step-by-step methods that make your trades disciplined and consistent.

Commodity Channel Index (CCI)
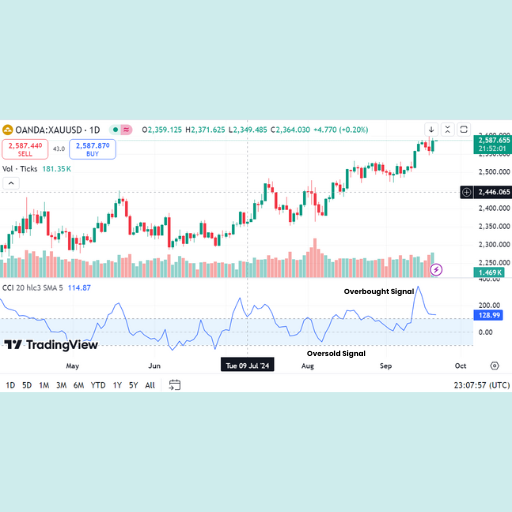
The Commodity Channel Index (CCI) is a versatile momentum-based oscillator developed by Donald Lambert in 1980. Its original purpose was to identify cyclical turns in commodity markets, but it is now widely applied to stocks, forex, and indices.
The CCI measures the current price level relative to an average price level over a specified period (typically 20 periods). It is an unbounded oscillator, meaning it has no theoretical limit to how high or low it can go, although most values typically fluctuate between +100 and -100.
What to Look For (Key Features and Signals)
The CCI is calculated using the difference between the typical price (High + Low + Close / 3) and the moving average of the typical price, normalized by a factor involving the mean deviation.
Here are the key signals traders look for:
- Overbought and Oversold Levels: The most common levels used to identify market extremes are +100 and -100.
- Overbought: When the CCI moves above +100, it suggests the price is rising quickly and may be considered overbought
- Oversold: When the CCI moves below -100, it suggests the price is falling quickly and may be considered oversold.
- Zero Line: While not the primary focus, the Zero Line provides a basic sense of trend strength:
- A sustained move above Zero indicates strength and a developing uptrend.
- A sustained move below Zero indicates weakness and a developing downtrend.
- The Power of +100 and -100 Crossovers (Trend Signals): The most reliable signals often come when the CCI moves back from the extreme zones.
- Bullish Signal: Look to buy when the CCI moves above -100$ (signaling the end of a strong downtrend) or when it moves above +100 (signaling the start of a new, strong uptrend).
- Bearish Signal: Look to sell (short) when the CCI moves below +100 (signaling the end of a strong uptrend) or when it moves below -100 (signaling the start of a new, strong downtrend).
- Divergence (Reversal Signal): Divergence between the CCI and price is a highly predictive signal:
- Bearish Divergence: Price makes a higher high, but the CCI makes a lower high. This indicates momentum is weakening and suggests a potential bearish reversal.
- Bullish Divergence: Price makes a lower low, but the CCI makes a higher low. This indicates momentum is increasing despite the price drop and suggests a potential bullish reversal.

The Market Doesn’t Owe You

Many traders take losing streak as personal.
Three losses in a row can make you think something is about to shift in your favor.
You start believing the next trade should work because the last few didn’t.
That belief is dangerous.
The market is not a slot machine.
It has no memory.
It does not balance out your pain with a reward.
Traders get into trouble when they expect the market to “give one back.”
They increase size.
They rush entries.
They ignore weak signals because they want a win more than they want accuracy.
This is how a normal drawdown turns into a full reset.
Your job is to break the mental link between past outcomes and future trades.
Each setup stands alone.
Each entry needs to justify itself without leaning on emotion or frustration.
When you stop expecting the market to make up for previous damage, you protect yourself from revenge behavior.
The market doesn’t owe you a win. It never has.
The faster you accept that, the faster you stop forcing trades that were never yours to begin with.


