
BTC Hits Danger Zone
....................................................................................................................


Good Morning!
TGIF 😊 and whether you’re sitting on green or gripping your losses, the question on every trader’s mind is the same:
Should I press it… or protect it?
By now, the week’s done most of its talking.
The moves have been made, the news priced in, and the charts have told their story.
Some traders are gearing up for one last clean setup.
Others are praying Friday does what Monday, Tuesday, and Wednesday didn’t.
But here’s the catch: Friday doesn’t fix poor prep - it exposes it.
So before you jump in guns blazing, take a breath.
Look at the week, not just the candle.
Did you earn your edge, or are you just hoping for a Hail Mary?
Either way, you’re here.
You showed up.
That’s step one.

7️⃣ Seven Signs That a Stock is About to Crash
Time to tick your crash warning checklist. An analyst highlights 7 early-warning signs from weak earnings to debt red flags that often precede steep stock crashes. Time to triple-check your portfolio.
📶 Broadcom Stock Breaks Record
Broadcom rallies after HSBC’s bullish outlook, lifted by strong ASIC growth and a $400 price target.
🚘 Tesla Europe Sales Slump
Tesla’s European sales fall for the 5th straight month—raising fresh signals of regional weakness for the EV giant.
📦 FedEx Cuts Cost, Profits Jump
FedEx slashes costs - raising its quarterly profit outlook and boosting investor mood despite sluggish revenue.
🤖 AI Stock Surge on DeepSeek Fade
After DeepSeek beta fizzles, AI plays jump -crypto-driven AI alert turns into real stock rally.
🪙 Gold Climbs on Trump–Iran Ceasefire
U.S. - Iran calm lifts gold as bond yields retreat - safe-haven demand re-enters the game.
⚠️ Bitcoin Danger Zone Ahead
Bitcoin falls toward $90K - the worst June since 2022, and bears are circling ahead of potential equity melt-down.

No New Trades Today – Market’s on Standby
Scanned the charts.
Zoomed in. Zoomed out.
Nothing clean. Nothing convincing.
With markets wobbling between uncertainty and hesitation, this isn’t the day to force anything.
No edge means no entry - that’s the rule.
The next setup’s coming. It always does. 🎯

Not Everything That Sounds Complicated Needs to Be

Trading sounds like a nightmare of confusing charts, blinking indicators, and enough jargon to make your head spin.
But here’s the truth most people don’t hear: it’s not about mastering complexity - it’s about cutting through it.
The right trading newsletters break down the chaos. No fluff, no intimidation.
Just clear, practical guidance that helps you understand what matters, what doesn’t, and how to actually make smart decisions.
You don’t need to “get” everything - just the right things.
👉 If you're done letting complexity keep you stuck, these newsletters will simplify your path forward.
Read them here.

Volume Oscillator
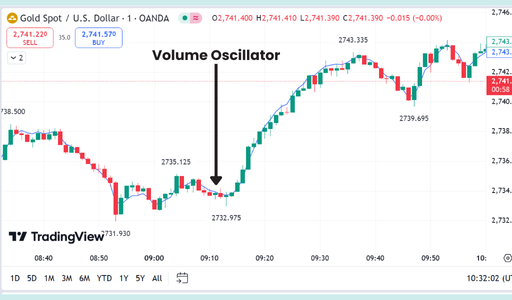
The Volume Oscillator is a technical indicator that measures the difference between two moving averages of trading volume, usually a faster (shorter period) and a slower (longer period) moving average.
This difference is often expressed as a percentage, indicating whether shorter-term volume is increasing or decreasing relative to longer-term volume.
It helps identify the strength or weakness behind price moves.
What to Look For:
- Positive Readings (Above Zero): When the Volume Oscillator is positive, it means the shorter-term volume is greater than the longer-term volume. This suggests that current volume activity is increasing relative to the average, often indicating strengthening momentum in the prevailing price trend.
- Negative Readings (Below Zero): When the Volume Oscillator is negative, it means the shorter-term volume is less than the longer-term volume. This suggests that current volume activity is decreasing relative to the average, often indicating weakening momentum in the prevailing price trend.
- Zero Line Crossovers:
- Crossing Above Zero: Can signal increasing volume strength, potentially confirming a new price trend or a breakout.
- Crossing Below Zero: Can signal decreasing volume strength, potentially indicating a weakening trend or consolidation.
- Confirmation of Price Trends:
- Rising Price, Rising Oscillator: Confirms strong buying interest and a healthy uptrend.
- Falling Price, Falling Oscillator: Confirms strong selling pressure and a healthy downtrend.
- Divergence:
- Bullish Divergence: Price makes lower lows, but the Volume Oscillator makes higher lows. This suggests that despite falling prices, underlying buying interest (volume) might be increasing, potentially signaling a bullish reversal.
- Bearish Divergence: Price makes higher highs, but the Volume Oscillator makes lower highs. This suggests that despite rising prices, underlying buying interest (volume) might be decreasing, potentially signaling a bearish reversal.
- Peaks and Troughs: Extreme peaks in the Volume Oscillator can sometimes indicate climactic buying or selling, potentially leading to a reversal. Low troughs can signal a lack of interest or consolidation.
- Indicator Settings: The choice of short and long period moving averages (e.g., 5-period and 20-period) will affect the sensitivity of the oscillator. Shorter periods make it more reactive.

The market doesn’t care that it’s Friday. It doesn’t care that you’re tired, tilted, or “trying your best.”
Someone out there got wrecked all week…Didn’t open a single chart…And now they’re showing up today like the market owes them a refund.

It doesn’t.
Trading isn’t magic. It’s math, mindset, and muscle memory. You don’t get to wing it all week and hope Friday saves you.
So here’s the play:
Kill the wishful thinking. Open your damn journal.
And make today the start of next week’s edge.
Because if you’re not learning, you’re just leaking.
🎯 Study hard, finish strong - and give yourself a reason to open the charts with confidence on Monday.
Thanks for riding with us here at Trading TLDR - where we cut through the noise and tell you what actually matters.


