BTC Crash Warning
....................................................................................................................


Good morning!
Markets are breathing again this morning. Futures on the Dow, S&P 500, and Nasdaq all jumped after Donald Trump dialed back his tough talk on China.
His Truth Social post - “Don’t worry about China, it will all be fine!” was enough to ease nerves after Friday’s tariff scare wiped out roughly $2 trillion in market value.
Dow futures climbed 1%, S&P gained 1.5%, and Nasdaq popped 2% as traders welcomed the softer tone.
It’s a sharp pivot from last week’s threat of a 100% tariff on Chinese goods, and investors are rushing back into risk assets.
But it’s not all clear skies. The federal shutdown drags on, and earnings season kicks off this week with major banks in focus.
It’s shaping up to be a volatile stretch but for now, relief is driving the tape.

💣 Dow, Nasdaq Futures & Shutdown Standoff
Shutdown impasse cools momentum - futures crawl while traders weigh political risk.
💉 AstraZeneca $4.5B Virginia Investment
AstraZeneca plows $4.5B into a Virginia plant, signaling a major push into U.S. drug manufacturing.
⚠️ Bitcoin Erases Gains + JPMorgan Warning
Bitcoin wiped out earlier gains, and JPMorgan’s sounding alarms, bulls are getting skittish.
🏆 Samsung Shares Hit Record
Strong numbers + AI chip deals send Samsung to new highs, bulls piling in fast.
💵 Dollar Shorts Burned
Traders betting against the dollar are getting squeezed, pain trade is real.
📉 Asia Trips, Europe Drifts
Kospi pops, Hang Seng sinks, and traders catch their breath after a wild Wall Street run.
🟡 Gold Streak Hits 8 Weeks
Safe-haven demand keeps gold shining as rate-cut bets and global turmoil push prices higher.

Successful Trading Is 80% Psychology, 20% Numbers
Trading success depends more on your mind than your math.
Numbers help you read the market. Psychology helps you survive it.
Your emotions decide if you stick to your plan or panic.
Your patience decides if you hold a winning position or close too early. Your discipline decides if you last long enough to win.
The best traders stay calm under pressure. They think clearly when prices move fast. They protect their capital before chasing profits.
Focus on your reactions. Learn to control your impulse to trade every move. Keep your risk small and your expectations realistic.
Trading rewards control, not complexity.
Upgrade your trading game with these recommendations

Bollinger Bands
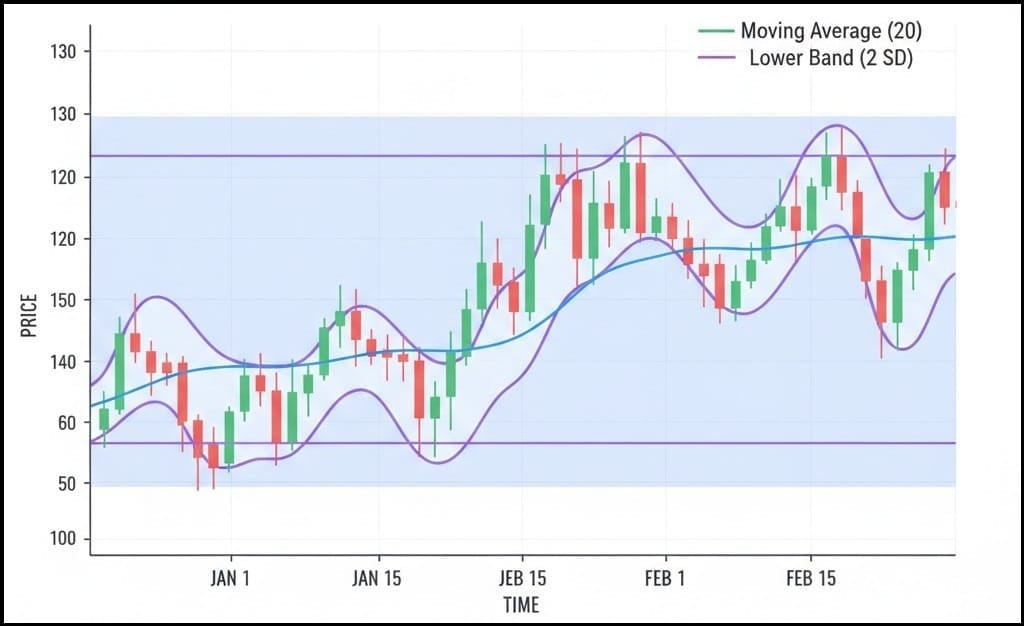
Bollinger Bands are a powerful technical analysis tool that measures a security's volatility and helps identify potentially overbought or oversold conditions. They are dynamic bands that adjust to price changes and are used to provide a relative definition of high and low prices.
What to look for:
Bollinger Bands are primarily used for mean reversion (prices returning to the average) and breakout signals.
1. The Squeeze (Volatility Contraction)
- What it is: The Upper and Lower Bands move closer together, indicating a period of low volatility and price consolidation (sideways movement).
- What it signals: The "calm before the storm." Periods of low volatility are often followed by periods of high volatility. A tight squeeze is a precursor to a significant price move or breakout in either direction.
- Trading Action: Traders wait for the price to break decisively out of the band (either above the Upper or below the Lower) as the initial directional signal, often using other indicators (like volume or RSI) for confirmation.
2. Band Walk (Trend Continuation)
- What it is: During a strong trend, the price tends to repeatedly touch or "walk" along one of the outer bands.
- What it signals: Strong trend continuation. In an uptrend, price will hug the Upper Band, while in a downtrend, price will hug the Lower Band. A break to the Middle Band or opposite band can signal a potential short-term pause or reversal.
3. Band Bounce (Mean Reversion)
- What it is: In a non-trending, or ranging, market, the price hits one of the outer bands and quickly reverses back toward the Middle Band.
- What it signals: Potential overbought (at the Upper Band) or oversold (at the Lower Band) conditions.
- Trading Action:
- Buy: When price touches the Lower Band and a reversal confirmation (like a bullish candlestick) is observed. The Middle Band or Upper Band may be used as a profit target.
- Sell: When price touches the Upper Band and a reversal confirmation (like a bearish candlestick) is observed. The Middle Band or Lower Band may be used as a profit target.

Rebuild
Loss streaks drain energy fast.
Many traders slipped since Friday. Some doubled down on bad entries. Others froze and missed setups. Both paths ended the same way - red.
This is where many give up. This is also where real traders separate themselves from tourists. Losing is not failure. Losing without learning is.
Most traders break after a bad run because they rush to fix it with bigger risk. That’s how small dents become deep holes.
Think of your account as a machine. Every forced trade is a wrench in the gears.
The only fix is control, not chaos.
I’ve seen this play out countless times. A trader takes three bad hits on Friday. Over the weekend they stew on it. Monday morning they size up to make it all back. One bad entry later, they’re out for the week.
That spiral kills accounts.
Smart traders slow down here. They don’t chase. They rebuild.
Do this today:
- Trade smaller. Give yourself room to breathe.
- Strip back your plan to one clean setup. No noise. No hero trades.
- Write down what went wrong in each losing trade. Be honest. You’re not reporting to anyone.
- Spot the repeated mistake. Most streaks come from one leak, not ten.
- Focus on execution, not outcome. Let data do the talking.
A trader who learns in drawdown is dangerous. This is where your edge gets sharper. If last week broke your rhythm, let this week rebuild your base.
You don’t need a miracle trade.
You need control.
One clean trade done right beats five panic trades.
Reset your pace.
Real growth happens in the slow rebuild, not in the rush to recover.