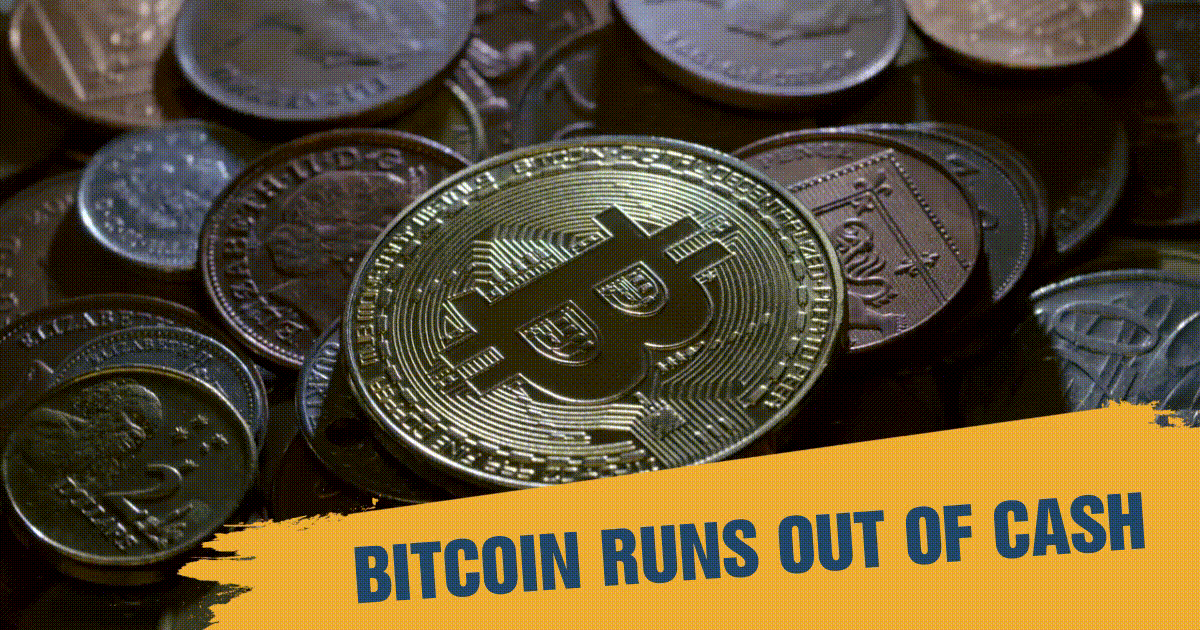
Bitcoin Runs Out of Cash
....................................................................................................................


Good morning traders,
Monday’s crypto dip had everyone on edge, but don’t sweat it - market swings are just part of the game!
Bitcoin’s slip below 100K may have raised eyebrows, but we’re keeping a close watch on its next move.
Meanwhile, gold’s retreat as the dollar flexed its muscles has us glued to the charts.
While gold has a history of bouncing back as the ultimate safe haven, will this time be any different?
No matter the twists and turns, we’ve got your back with the crucial updates you need.
Let’s crush this Wednesday!

🏃♂️ Gold’s Sprint Stumbles
Gold prices retreated from their multi-month highs as the US dollar gained strength, leaving investors questioning the metal’s near-term momentum. This pullback comes amid shifting market dynamics and a stronger greenback, which often pressures gold.
📉 Bitcoin Slip Below 100K as Traders Take Profits
Bitcoin slipped as traders cashed in profits, sparking concerns about the cryptocurrency’s ability to sustain its recent gains. This dip comes despite ongoing optimism around Bitcoin ETFs and market momentum.
🛑 Bitcoin ETF Weekly Inflows Slowdown
Weekly inflows into Bitcoin ETFs slowed despite post-Trump inauguration optimism, signaling a potential cooling-off period for crypto investments. Are investors taking a breather, or is this a sign of deeper caution?
🤖 Chinese AI Stocks Surge as DeepSeek Shakes Up Market!
Chinese AI startup DeepSeek has shaken global tech stocks with its cost-effective AI model, challenging the massive capital expenditures of Silicon Valley giants.
🌍 Global Shares Dip as Wall Street Retreats from Record Highs
World shares were mostly lower on Monday after U.S. stocks pulled back from their all-time highs, with many Asian markets closed for holidays. European markets like Germany’s DAX and France’s CAC 40 saw declines, while U.S. futures also sank.
⚔️ Stocks Drop on Tariff Fears, China AI Surge
European and U.S. stock futures fell as a U.S.-Colombia tariff dispute reignited trade war fears, while Chinese tech firms linked to DeepSeek surged on its cost-effective AI model.
🇺🇸🛢️ Oil Slips as Trump Pressures OPEC to Cut Prices
Oil prices fell after President Trump repeated his call for OPEC to reduce prices, aiming to pressure Russia and end the Ukraine war. With OPEC+ yet to respond and U.S. output rising, will Trump’s strategy backfire or bring prices down?

Unfortunately, I’m down with a bug. I won’t be able to give updates for now as I need to rest, but I’ll be back with an update as soon as I can.
Catch you soon!

Think Market Analysis Feels Like Watching Paint Dry? Here’s the Fast Track!
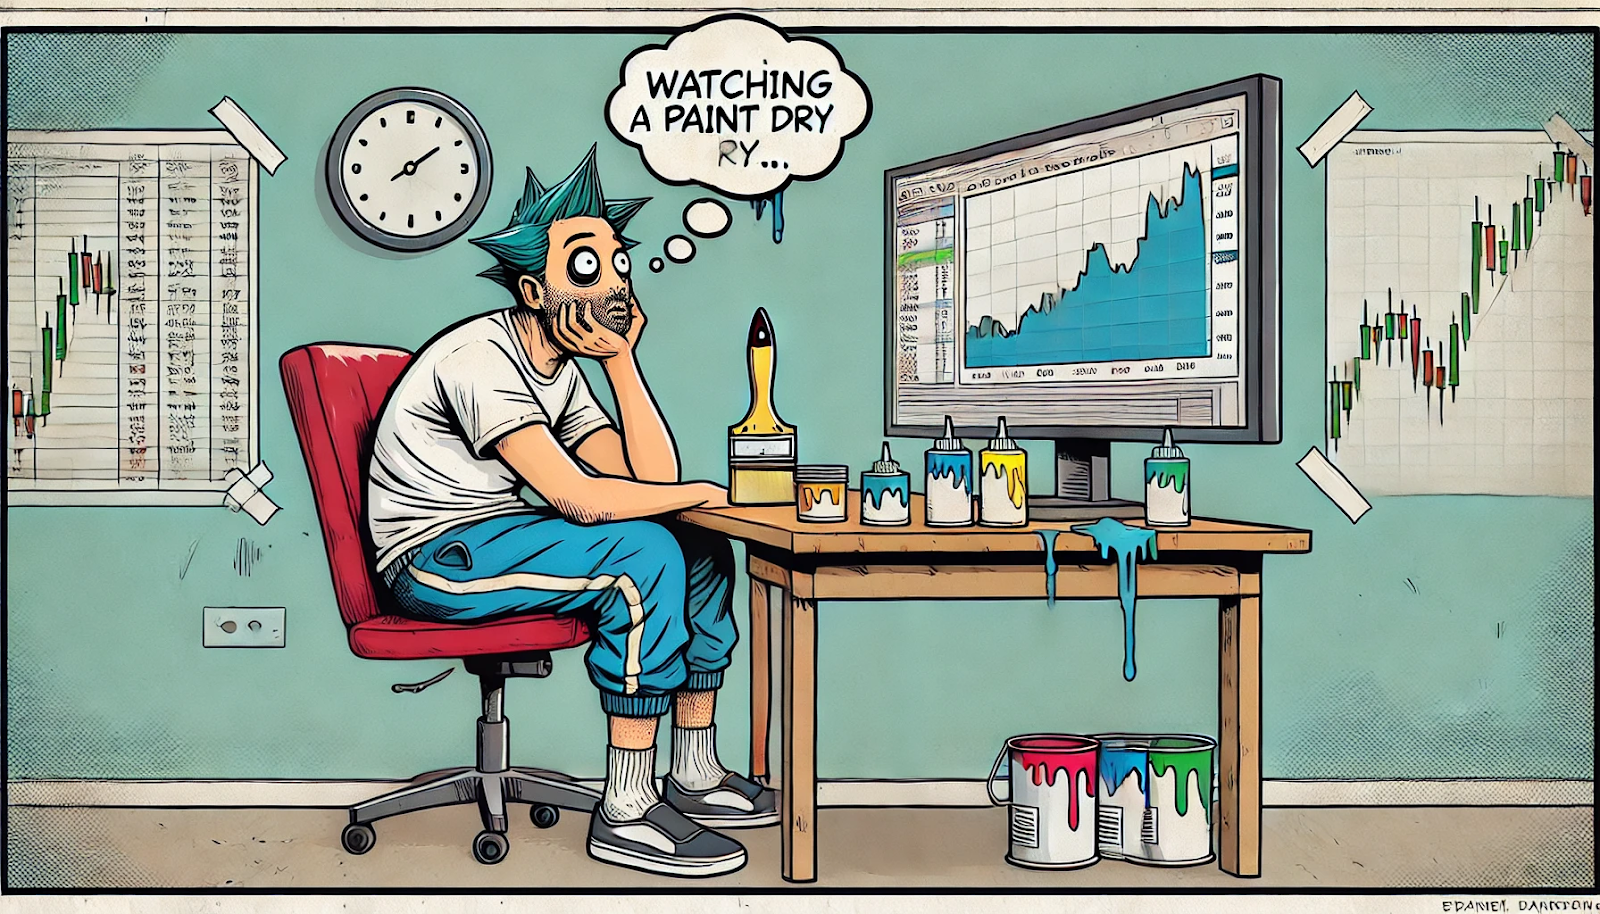
Let’s be real- traditional market analysis can feel as exciting as watching paint dry.
You stare at charts, crunch numbers, and scroll through endless data, only to end up more confused than when you started.
But what if you didn’t have to endure that painstaking process?
These AI newsletters cut through the monotony, using advanced algorithms to process market data in seconds and deliver actionable insights.
Find out how these newsletters can save you time and turn analysis into a fast, efficient process!

SuperTrend Indicator
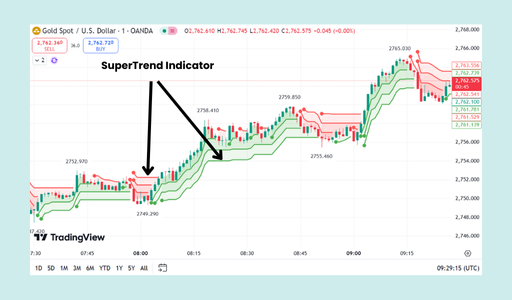
The SuperTrend Indicator is a trend-following technical analysis tool that helps identify the direction of the market and provides dynamic support and resistance levels.
It's particularly useful for identifying strong trends and generating trading signals.
What to Look For:
- Trend Identification:
- When the price is above the SuperTrend line, it suggests an uptrend.
- When the price is below the SuperTrend line, it suggests a downtrend.
- Trading Signals:
- A bullish crossover occurs when the price crosses above the SuperTrend line, indicating a potential buy signal.
- A bearish crossover occurs when the price crosses below the SuperTrend line, indicating a potential sell signal.
- Dynamic Support and Resistance: The SuperTrend line itself acts as a dynamic support level in an uptrend and a dynamic resistance level in a downtrend.

If there’s one habit that’s transformed the way I approach trading (and life in general), it’s this: I never trust my brain to hold onto “vital” information.
Let me be real - no matter how sharp you are, your memory will fail you at some point.

That’s why I’m obsessive about taking notes.
Whether it’s during a webinar, analyzing a trade, or reading a market update, I jot everything down.
My notebook isn’t just paper; it’s my strategy vault.
Why does this matter? Because clarity is power.
When the pressure’s on and emotions run high, your brain might freeze, but your notes won’t.
They’re your cheat sheet when doubt creeps in or when you need a quick reminder of why you entered a trade.
Here’s the thing: Listen more, jot more, speak less.
The quieter you are, the more you learn.
The more you learn, the better decisions you make.
And in trading, better decisions equal growth .
So, grab a notebook.
Write down the lessons, your mistakes, your wins, and those tiny insights that feel like nothing in the moment.
Over time, those notes might just be the edge that sets you apart.