Bitcoin pumping these coins
....................................................................................................................


Happy Wednesday, traders!
We’re back with a fresh lineup, and this week’s updates are too good to miss.
Goldman just pushed its $3K gold target further back—what does this mean for 2025?
Bitcoin's recent surge to $100K lit a fire under Solana and SUI, but Tuesday's dip dragged altcoins down with it.
A potential rebound could spark another altcoin rally. Oh, and Meta Planet’s gutsy 10,000 BTC bet?
That’s a story you’ll want to follow.
You might also want to check what AI thinks crypto will do in 2025?
Might be interesting... Might make you rich... Might make you cry.
If you’ve been with us for a while, you know this is where insights turn into winning moves.
Let’s make this week count.
Dive in and stay ahead!

⏳ Goldman Predicts Delayed Gold Surge!
Goldman Sachs just pushed ”back” its $3,000 target for gold into the future! What does this mean for your investments in 2025? Get in on the details here.
🪙 Gold Investors Stay Bullish Amid Volatility
Gold is set to thrive in 2025, fueled by Trump-era volatility and rising global uncertainties. Investors are staying bullish - should you?
💼 Metaplanet's Bitcoin Eyeing 10,000 BTC Holdings in 2025
With Bitcoin predicted to skyrocket, this could be one of the boldest bets in the crypto world. Are you positioning your portfolio for the pump?
📈 Bitcoin Price Surge Could Pull Sol, SUI, ICP, and ENA Up
If Bitcoin breaks past $100K, it could pull Solana, SUI, ICP, and more higher. See why this could be the case in this article.
🤖 AI Predicts the Perfect Crypto Portfolio for 2025
AI models are claiming they’ve found the ultimate crypto portfolio for 2025. Curious? Here's how the future of investing might look.
💲 Dollar Hits Two-Year High, Pressure Builds on Yuan
The dollar’s hitting a two-year high, putting pressure on the yuan - what does this mean for the global economy?
🗓️ The January Effect: Will Stocks and Crypto Boom or Bust?
Will the January Effect propel the markets to new heights, or are we headed for a volatile start to the year? Stay ahead of the curve with insights from this article.

Let me update you on our recent trading activities across several positions:
Exxon Mobil
We added our third and final position on December 27th, which adjusted our break-even price to $109.84.
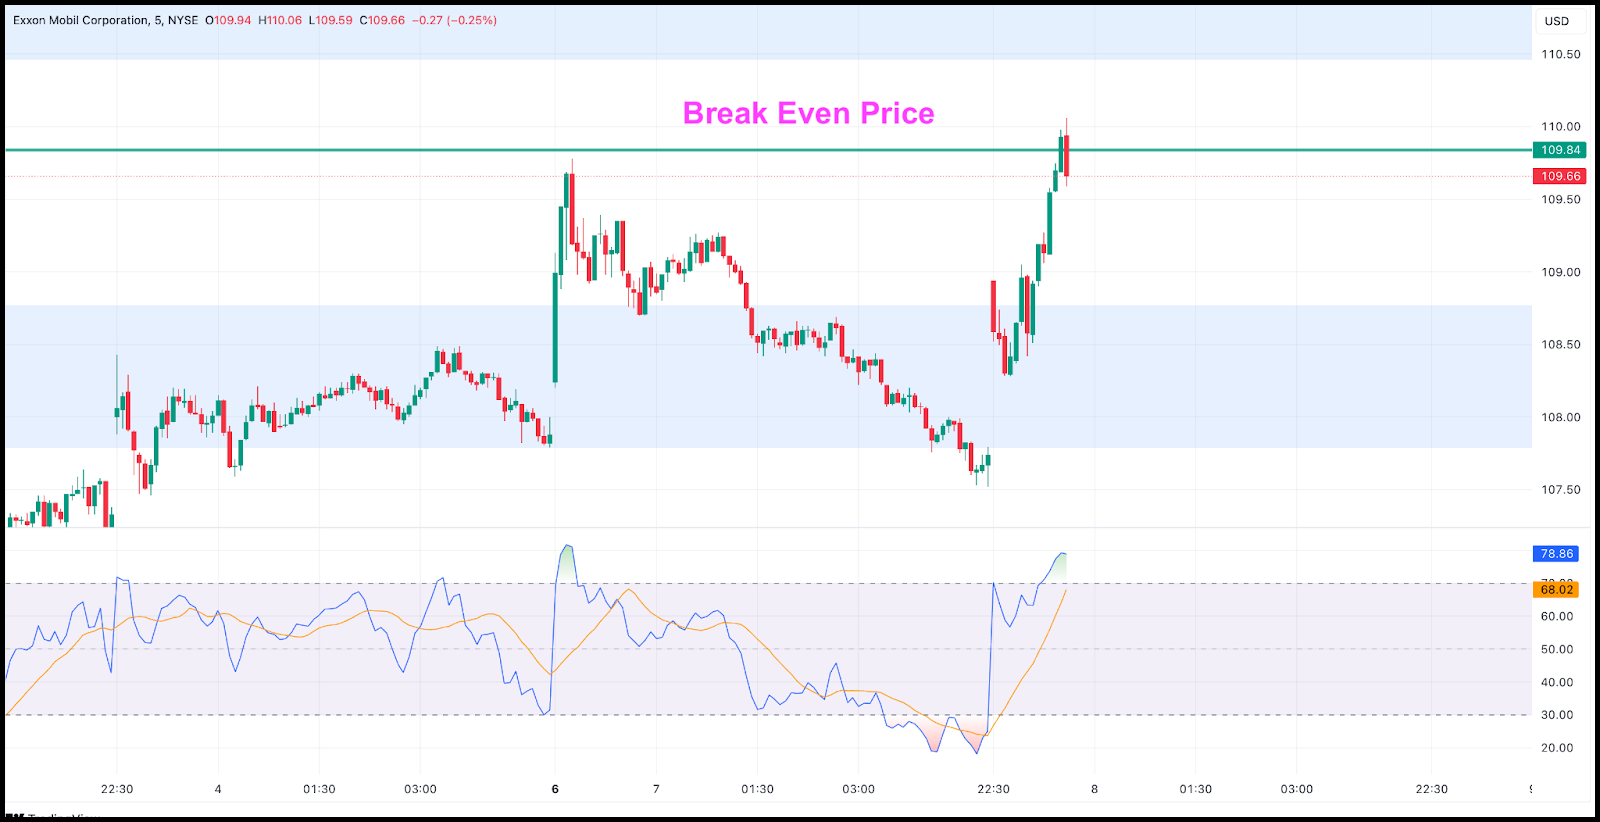
Yesterday, when the price finally crossed above our break-even level, I decided to exit the position at cost.
After holding this stock for nearly a month, I believe it's time to reallocate these funds to more promising opportunities.
Lumen Technologies (NYSE: LUMN)
We've successfully closed our entire position.
Following our initial 3.01% profit on the first half reported earlier, I've now sold the remaining shares at a 4.75% profit.
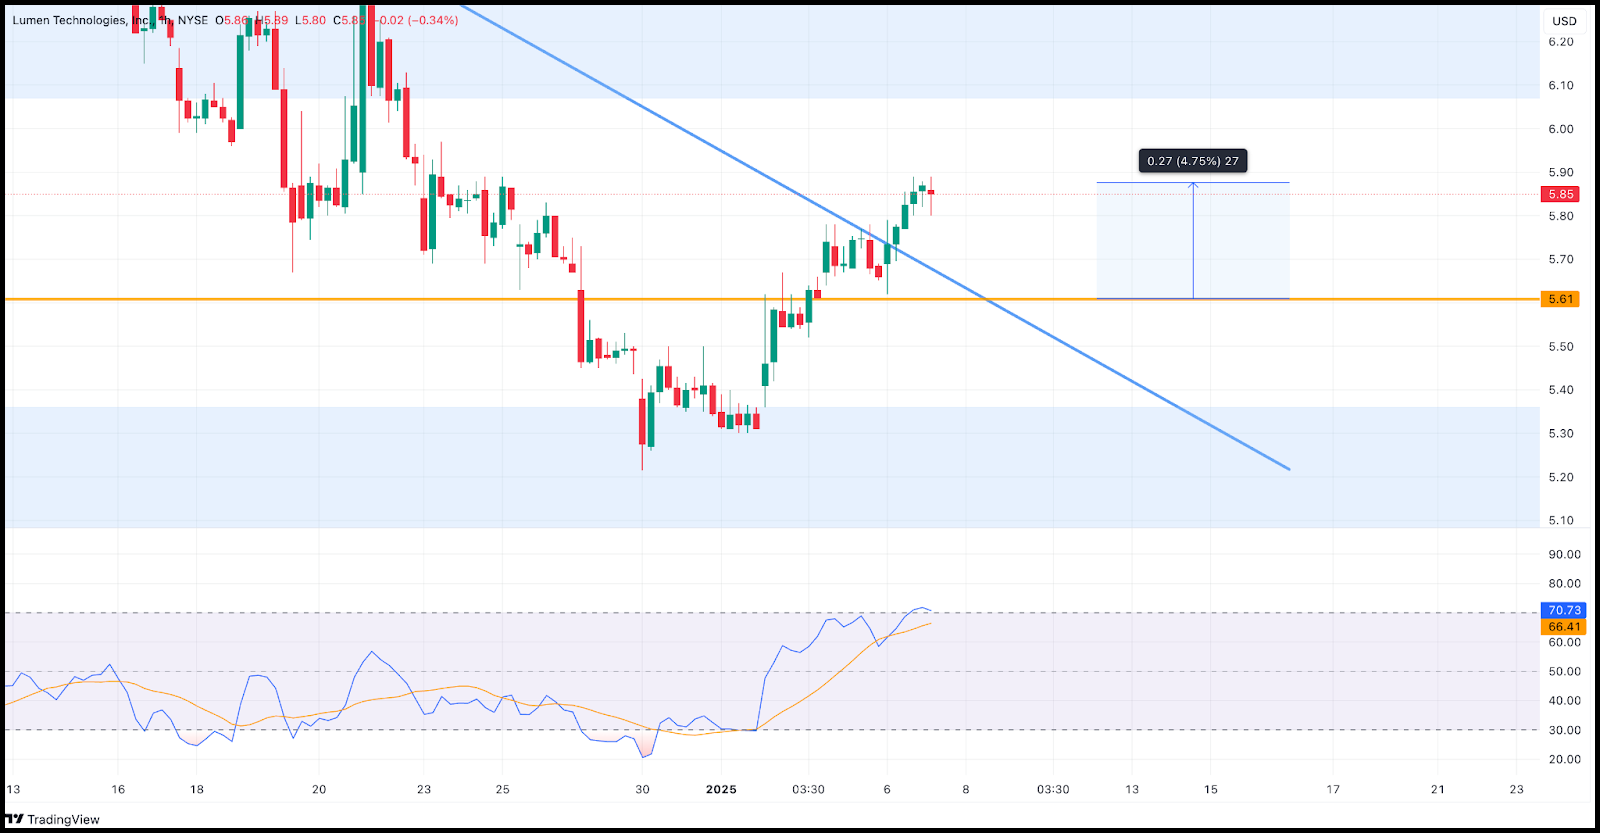
The stock performed exactly as anticipated.
Micron Technology (NASDAQ: MU)
MU has been one of our best performers this week.
After taking our initial 3.05% profit on half the position, the stock continued its impressive upward trajectory.
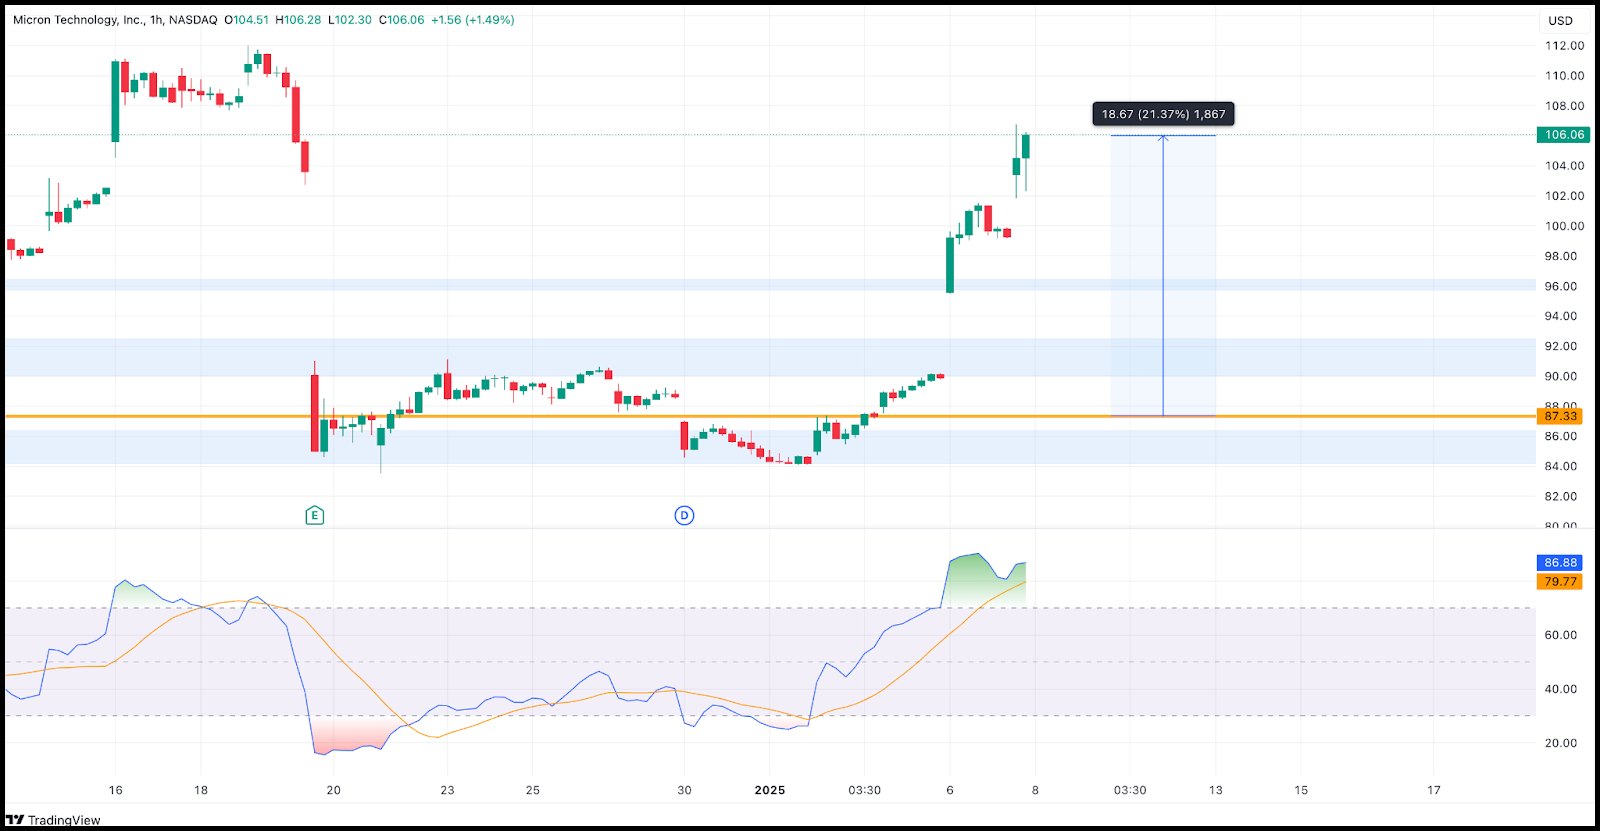
I've now closed the remaining position at $106.02, securing an outstanding 21.37% profit.
Caterpillar (NYSE: CAT)
Our January 6th recommendation at $363.71 saw immediate success as the stock gapped up at market open.
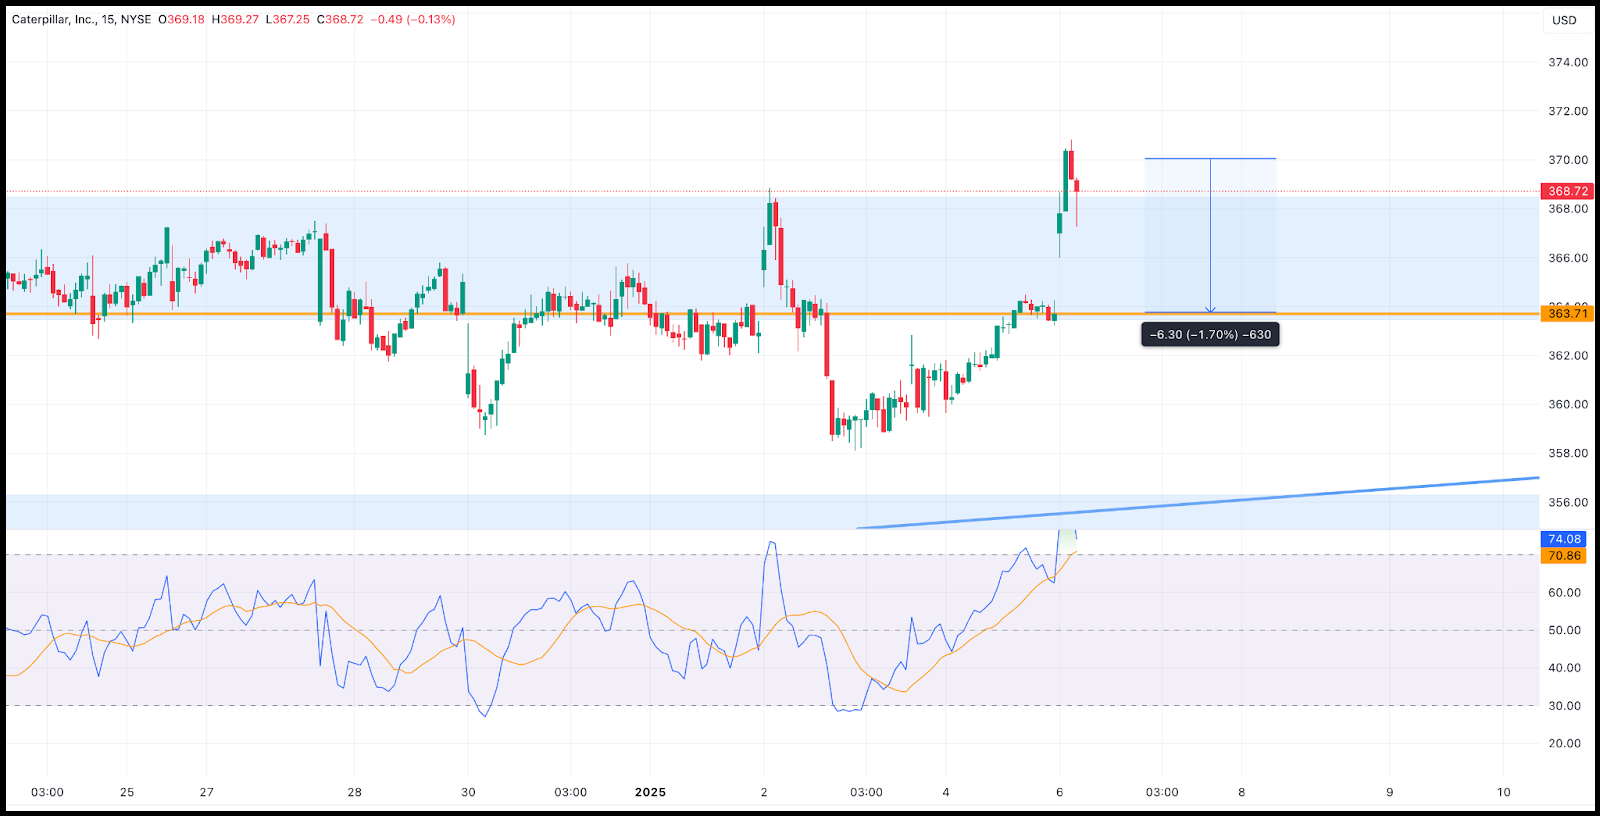
Given the 10x leverage on this position, I closed the trade at $370.06 for a 1.70% profit (pre-leverage).
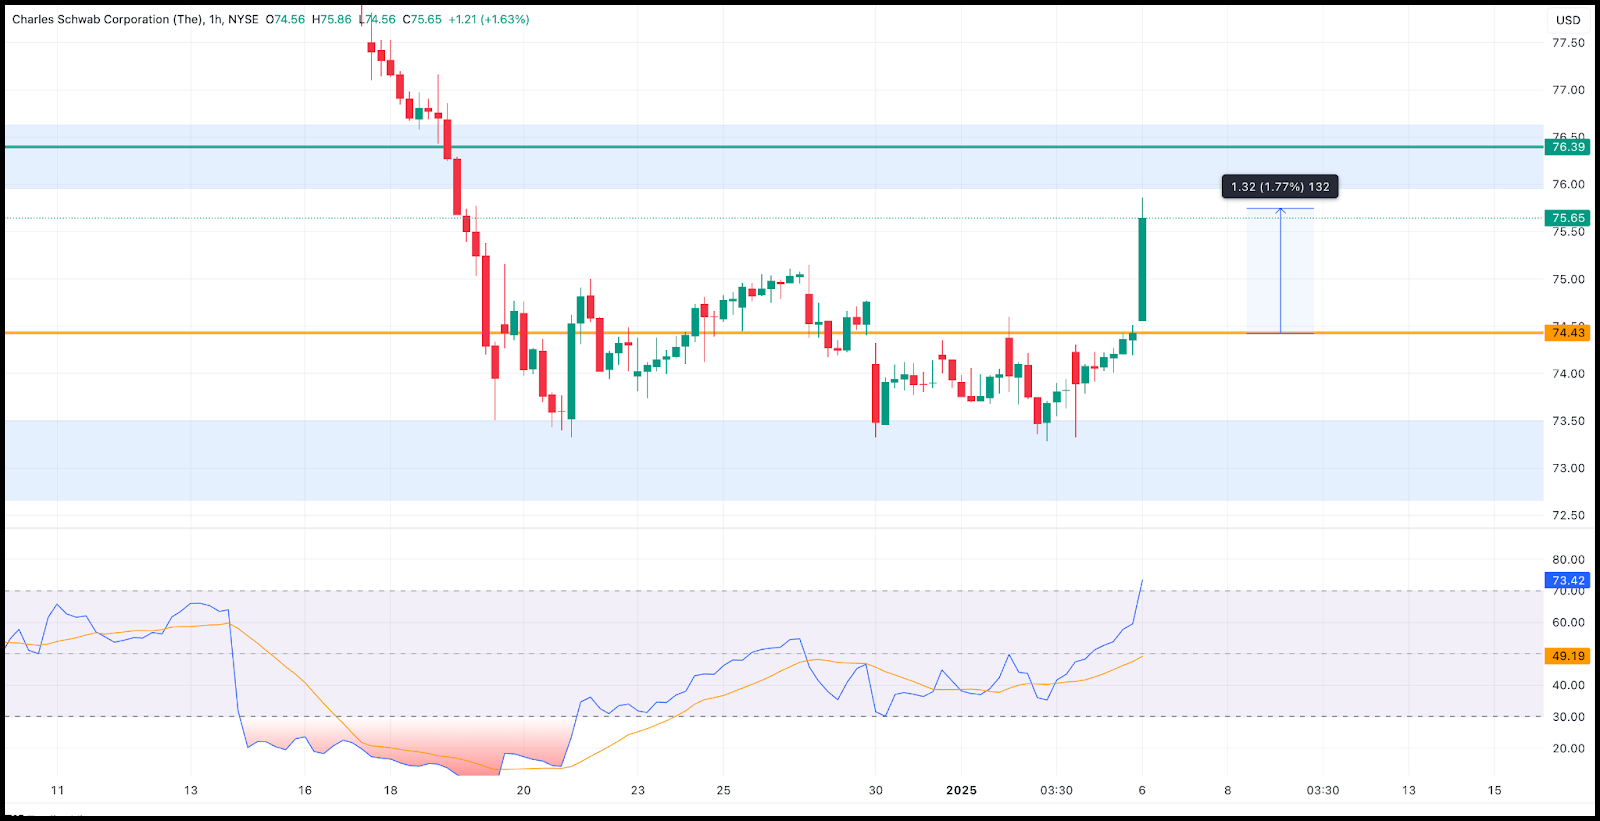
Charles Schwab Corp (NYSE: SCHW)
SCHW so hit our targets precisely.
From our entry at $74.43, the stock climbed as high as 2%.
I secured profits at $75.65, resulting in a 1.93% gain (pre-leverage).
Currently, we've successfully closed all our recommended positions with a 100% win rate, except for Oracle (ORCL).
This position hasn't performed as expected, and I'm considering adding a third position in the coming days to lower our break-even price.
I'll keep you informed when I make this adjustment.

Scared of Losing Big? Here’s the Key to Smarter, Safer Trades!
The fear of taking a big loss can make trading feel like an all-or-nothing gamble.
Without understanding how to manage risks, every move seems like a roll of the dice.
But it doesn’t have to be that way.
These newsletters are your guide to smarter, safer trading, breaking down risk management into simple steps that protect your wallet and give you the confidence to grow.
Click here to learn how to trade strategically, minimize risks, and take control of your trading journey.

Disparity Index
The Disparity Index is a technical analysis indicator that measures the distance between the current price and a moving average, expressed as a percentage.
It helps traders assess the strength and direction of the current trend and identify potential overbought or oversold conditions.
What to Look For:
- Trend Strength:
- A high positive Disparity Index value indicates that the price is significantly above its moving average, suggesting strong bullish momentum.
- A high negative Disparity Index value indicates that the price is significantly below its moving average, suggesting strong bearish momentum.
- Overbought/Oversold Conditions:
- Extreme positive Disparity Index values may indicate an overbought condition, suggesting a potential price correction.
- Extreme negative Disparity Index values may indicate an oversold condition, suggesting a potential price rebound.
- Trend Reversals:
- Divergence between the Disparity Index and the price can signal potential trend reversals. For example, if the price is making higher highs, but the Disparity Index is making lower highs, it could indicate a weakening uptrend.

You’ve decided this is the year to take the plunge into trading - but let’s be real, a few doubts might be creeping in.
“Do I know enough to start?”
“Do I have enough capital?”
And maybe the biggest one: “If I can’t afford a trading class, is this even possible for me?”
Here’s the truth: those thoughts are holding you back. It’s time to let them go.
You don’t need a big budget to start. What you need is clarity, a plan, and the will to stick to it.
Write this down, and follow it like your trading life depends on it:
- Risk & Money Management – This is non-negotiable. Protect your capital first; profits come later.
- Market Structure – Learn the basics of trends, Break of Structure (BOS), and Change of Character (COCH). This is your trading foundation.
- Candlestick Structure & Patterns – Master this to understand price action at its core.
- Entry & Exit Strategies – Timing is key. Know when to get in and when to step back.
- Demand & Supply Zones – Points of Interest like Fair Value Gaps (FVGs), Order Blocks, Breaker Blocks, QMR, and OTE will guide you.
- Liquidity & Inducements – Spot where the big money is lurking.
- Entry Models – Build and refine setups that work for you.
Now you’ve got your roadmap to success.
The best part? You don’t need to spend a dime. There are free resources everywhere - YouTube channels?!
But don’t stop there.
Newsletters like ours are packed with insights too.
Sections like Winning Stocks offer practical guides to spotting profitable trades and making smarter investment decisions.
The tools are right at your fingertips.
All you need to do is show up, stay consistent, and put in the work.
Don’t sit back. Don’t give up.
Make 2025 the year you take control of your trading journey.
Let’s win this together!


