Big Feb Jobs Report
....................................................................................................................


Happy Friday!
If you feel like you’ve aged five years since Monday, you are definitely not alone. It has been a high-stakes week here at Trading TLDR, and the market is certainly not making it easy for us to slide into the weekend.
Right now, we are watching a volatile cocktail of geopolitical tension and economic data.
US futures are drifting lower this morning as investors react to the expanding conflict between the US-Israel coalition and Iran. The Dow is feeling the brunt of it, slipping another 0.2% after a rough Thursday session. In fact, the Dow has dropped over 2% this week, officially breaching negative territory for 2026. While the Nasdaq has bucked the trend to head for a small weekly gain, it's still shedding about 0.3% in early trading.
The real heat is in the energy sector. Oil prices surged yesterday, with WTI and Brent crude hitting their highest levels since 2024. We're actually on track for the largest weekly percentage gain in crude since March 2022.
On the home front, all eyes are on the February jobs report dropping today. Economists are bracing for a major cooldown—expecting only 55,000 new jobs, a steep drop from January’s 130,000.
As if that wasn't enough, a legal bombshell just hit the headlines: a federal judge ruled that the administration must start refunding up to $130 billion in tariffs recently struck down by the Supreme Court. With over 2,000 companies like Costco and FedEx involved, this is a massive story we’ll be tracking closely.
It’s a lot of noise to navigate, but that’s exactly why we’re here.
Let's dig into the details and finish this week on a strong note.

📉 Dow Plunges 785 Points as Oil Surges Above $81
Stocks tumbled and volatility spiked as fears of a prolonged Iran conflict rattled markets, while oil jumped over 8% in its biggest daily gain since 2020 amid worries about supply disruptions through the Strait of Hormuz.
🛢️ Oil Heads for Biggest Weekly Jump Since Ukraine War
Crude prices are on track for their largest weekly surge since Russia’s 2022 invasion of Ukraine, climbing nearly 20% as the escalating Middle East conflict fuels fears of major supply disruptions.
🇮🇳 Foreign Investors Dump Indian IT Stocks Amid AI Fears
Global funds pulled nearly $1.85 billion from India’s tech sector in February, triggering the industry’s worst monthly drop since 2008 as concerns grow that AI disruption could squeeze future earnings.
🇰🇷 South Korea’s Stock Market Swings from Crash to Rally
The Kospi plunged 12% in its worst single-day drop on record before roaring back nearly 10% the next day, highlighting extreme volatility in what was the world’s best-performing stock market just last year.
🪙 Bitcoin Holds $70K as Traders Await Key Jobs Report
Bitcoin steadied above $70,000 as investors braced for the U.S. jobs data, with analysts warning the latest bounce could be a temporary relief rally rather than the start of a new crypto bull run.
🌏 Asian Markets Rebound Despite Oil Shock
Asia-Pacific stocks staged a late comeback after Wall Street’s selloff, as investors weighed the impact of rising oil prices and potential energy supply disruptions linked to the Iran conflict.
🛡️ Dollar, Bonds, or Gold? Investors Debate the Ultimate Safe Haven
With Middle East tensions shaking markets, investors are rushing toward traditional shelters—but surprising shifts in gold and the U.S. dollar are reigniting the debate over which asset truly protects wealth in a crisis.

Your Last Trade Still Has Something to Teach You
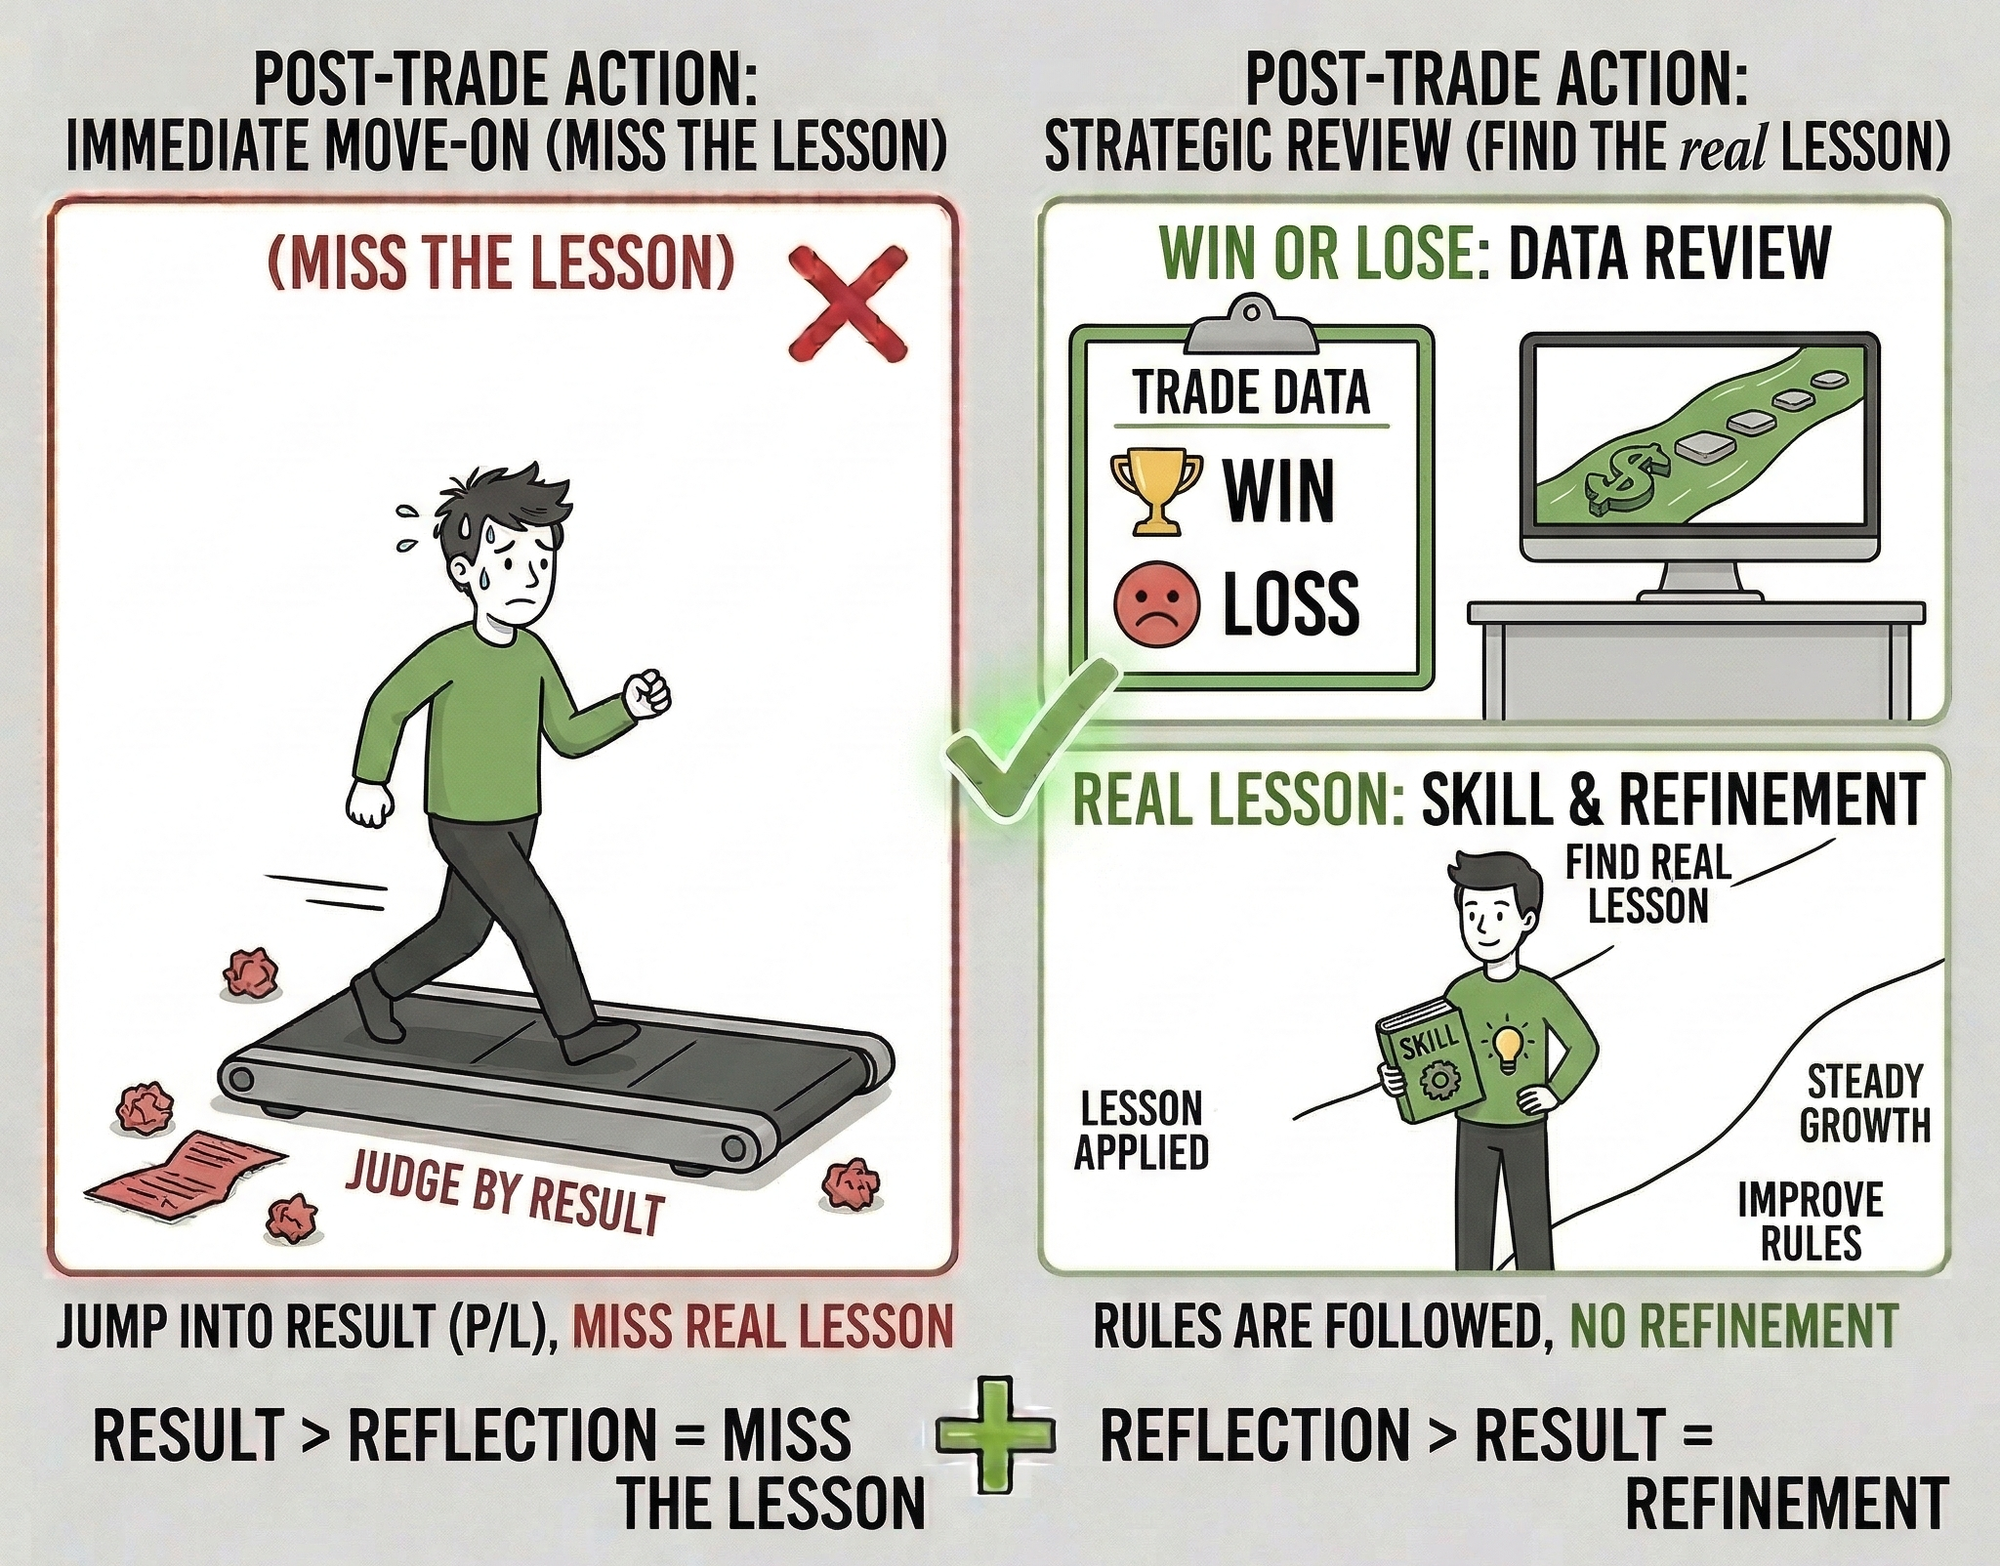
Many traders close a trade and immediately move on.
Win or lose, they just look at the result and jump into the next setup. No review. No reflection.
But every trade carries information.
A winning trade might still hide mistakes. A losing trade might have been executed perfectly. If you only judge trades by profit or loss, you miss the real lesson.
The best traders slow down after the trade is over. They ask simple questions. Did I follow my rules? Was the setup clear? Did I respect my risk? What could I improve next time?
This is where real progress happens.
Reviewing trades helps you spot patterns. You start noticing small habits, emotional reactions, and repeated mistakes. Over time, those lessons turn into stronger discipline and better decisions.
Your last trade is not just a result.
It’s feedback.
If you want trading insights that help you think more clearly about your decisions and build stronger habits as a trader, these newsletters are worth reading. They focus on practical ideas and steady improvement.

Piercing Line

The Piercing Line is a two-candle bullish reversal pattern that occurs at the end of a downtrend. It begins with a strong red candle, followed by a green candle that gaps lower but then rallies significantly to close deep within the body of the previous day’s red candle. It represents a "failed breakdown" where the bears lost their grip and the bulls reclaimed the territory.
🛠️ The Strategy Logic
Use these logical triggers to identify when a downtrend has "bottomed out" and a reversal is starting:
- IF: The second (green) candle closes above the 50% midpoint of the first (red) candle’s body...
- THEN: The pattern is valid. This "piercing" of the midpoint shows that bulls have recovered more than half of the previous day's losses, proving a major shift in sentiment.
- THEN: The pattern is valid. This "piercing" of the midpoint shows that bulls have recovered more than half of the previous day's losses, proving a major shift in sentiment.
- IF: The green candle "gaps down" below the previous day's low before rallying...
- THEN: The "Bear Trap" is set. This shows that the market tried to continue the crash, but found no sellers at the lower prices, leading to a violent short-covering rally.
- THEN: The "Bear Trap" is set. This shows that the market tried to continue the crash, but found no sellers at the lower prices, leading to a violent short-covering rally.
- IF: The Piercing Line forms after a long decline and hits a major Support level or the Lower Keltner Channel...
- THEN: You have a "High-Conviction Reversal." The technical floor provides the reason for the bounce, and the Piercing Line provides the visual confirmation that the floor is holding.
- THEN: You have a "High-Conviction Reversal." The technical floor provides the reason for the bounce, and the Piercing Line provides the visual confirmation that the floor is holding.
- IF: The green candle completely "engulfs" the previous red candle (closes above the red open)...
- THEN: The pattern has upgraded to a Bullish Engulfing pattern. This is even more powerful than a Piercing Line, as it shows total dominance by the buyers.
- THEN: The pattern has upgraded to a Bullish Engulfing pattern. This is even more powerful than a Piercing Line, as it shows total dominance by the buyers.
- IF: The volume on the second (green) day is higher than the first (red) day...
- THEN: The move is supported by "Accumulation." High volume on the piercing day suggests that institutions are buying the dip, making the new uptrend more likely to last.
💡 Pro Tip
The "Midpoint" Rule: The most common mistake is entering a trade on a green candle that doesn't reach the 50% mark of the previous red candle. If it closes below the midpoint, it is called an "In-Neck" or "On-Neck" pattern, which is actually a bearish continuation signal. To be safe, always wait for that 50% "pierce"—if the bulls can't even take back half of yesterday's losses, they aren't strong enough to lead a reversal yet.

The AI Indicator Overload

Every week there’s a new tool.
AI signals.
Predictive models.
“Smart money” dashboards.
Indicators promising 90% accuracy.
So you add one. Then another. Then five more.
Your chart slowly turns into a control panel.
Signals everywhere. Arrows. Alerts. Colored zones.
And yet… when it’s time to take the trade?
You hesitate.
Because now the problem isn’t lack of information.
IT’S TOO MUCH INFORMATION.
One indicator says buy. Another says wait. The AI model flashes “bullish probability.” Your momentum tool whispers “overbought.”
Now conviction disappears.
WHEN EVERYTHING TALKS, NOTHING IS CLEAR.
This is the hidden danger of modern trading tools. They promise clarity — but often deliver confusion.
The more signals you rely on, the harder it becomes to trust your own decision-making.
So traders fall into a loop:
Add more tools → Seek more confirmation → Delay execution → Miss the move.
Or worse…
Take the trade late because six indicators finally agree.
By then the edge is gone.
Professional traders think differently.
They don’t chase more signals. They chase clear structure.
Price levels. Risk parameters. Simple repeatable patterns.
Tools can support a decision. They should never replace it.
Because here’s the uncomfortable truth:
Most traders don’t add indicators for accuracy.
They add them for comfort.
More confirmation feels safer.
But trading was never meant to feel perfectly safe.
It’s a probability game.
And probability requires decisiveness, not 14 layers of validation.
Strip your chart down.
Keep what actually improves decision quality.
Remove what only reduces confidence.
Because the real edge is rarely hidden inside another tool.
It’s in your ability to see the market clearly — and act when the setup appears.