
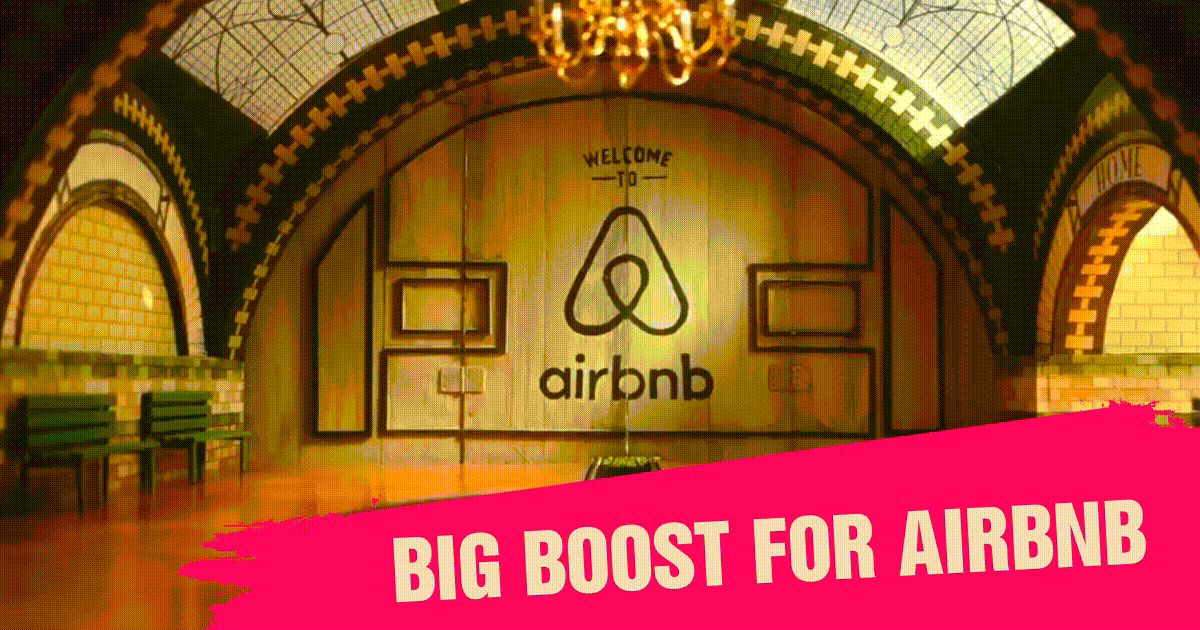
Big boost for Airbnb
....................................................................................................................


Good morning traders - and welcome to the Friday fakeout. 📉
Markets were partying early as Trump dialed down the Powell bashing and hinted at peace with China. Dow soared 400+, Nasdaq popped 4%, AI stocks exploded… but then a single Treasury comment slammed the brakes. 💥
Musk ditched DOGE to refocus on Tesla, Airbnb got the Cathie Wood blessing, and Bitcoin just leapfrogged Google. Yes — $93K and counting. 👑
But don’t get cozy yet - gold dropped from record high, sentiment twitchy, and traders are still side-eyeing those tariffs.
The crucial update? Let’s get you to the news. ⚡

📉 Dow Soars 400, Nasdaq Rockets 4%… Then Crumbles
Trump’s softer tone on Powell and China lit up markets early — but the rally fizzled fast. A sharp comment from the Treasury snuffed the risk-on mood by the close.
📈 Rally Mode: Activated
Dow popped 419 points, S&P climbed 1.7%, and AI stocks took off. All it took was Trump playing nice — for now.
🐶 Musk Leaves DOGE, Tesla Rises
Shares jumped 5% after Musk vowed to shift focus back to Tesla, despite a brutal earnings miss. But retail isn’t buying the pivot just yet — sentiment stayed deep in the red.
🐉 Tariff Talk Lifts Wall Street
China trade war may cool off as Trump signals he's open to a deal. Markets loved it — stocks soared, gold cratered, and the dollar punched higher.
🏠 Airbnb Gets a Cathie Boost
|Cathie Wood doubles down on Airbnb while trimming Microsoft. Insiders are selling, but the retail crowd? Getting bullish again.
👑 Bitcoin Just Beat Google
BTC hit $94K and blew past Google to become the world’s 5th biggest asset. Crypto’s back on top — is $100K next?
👱♂️ Trump's Talk Tanks Gold
A few words from Trump - no more Powell drama, friendlier China tone - and gold prices buckled. What happens if negotiations fail?

Update on Adobe Inc. (NASDAQ: ADBE)
This was a stealthy setup that played out exactly as expected.
I gave a buy call at $349.90, and just a few sessions later, Adobe climbed to our TP1 at $360.48.
Delivering a 2.93% gain before leverage.
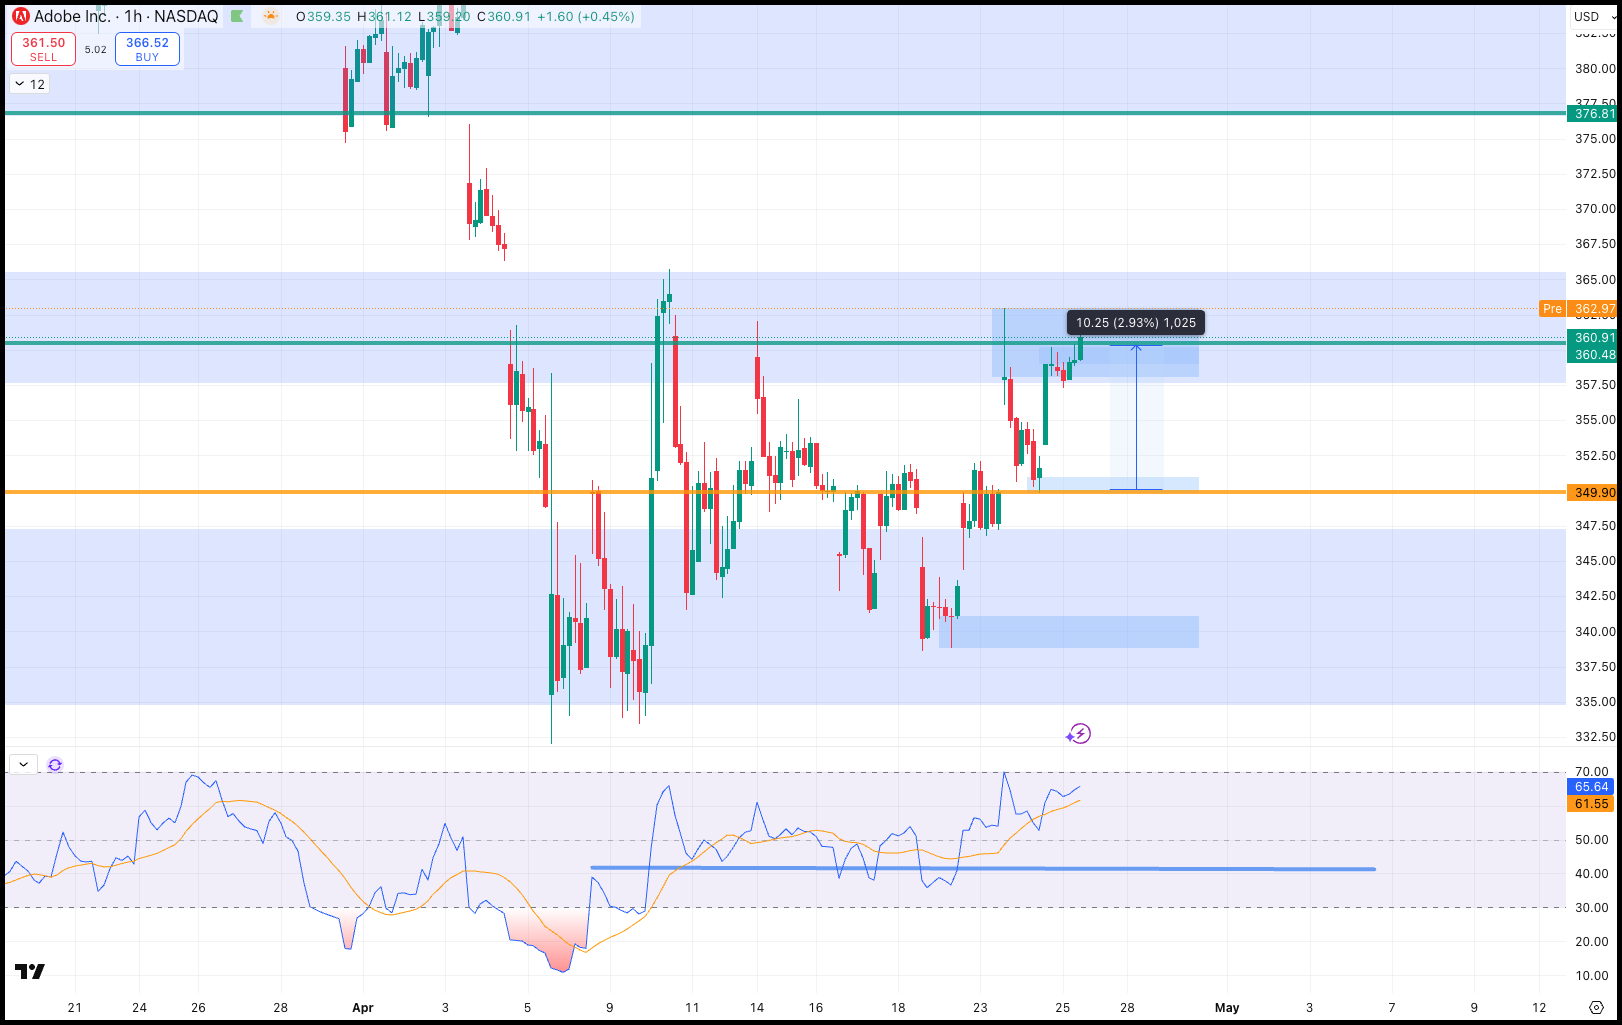
What made this one special?
While it hadn’t broken out of the upper band, it had already snapped the RSI trendline.
A quiet but powerful early signal that momentum was shifting.
A textbook early entry. Quiet move. Clean profit.

Lost in the Markets Like a Tourist Without Google Maps? Let’s Fix That.
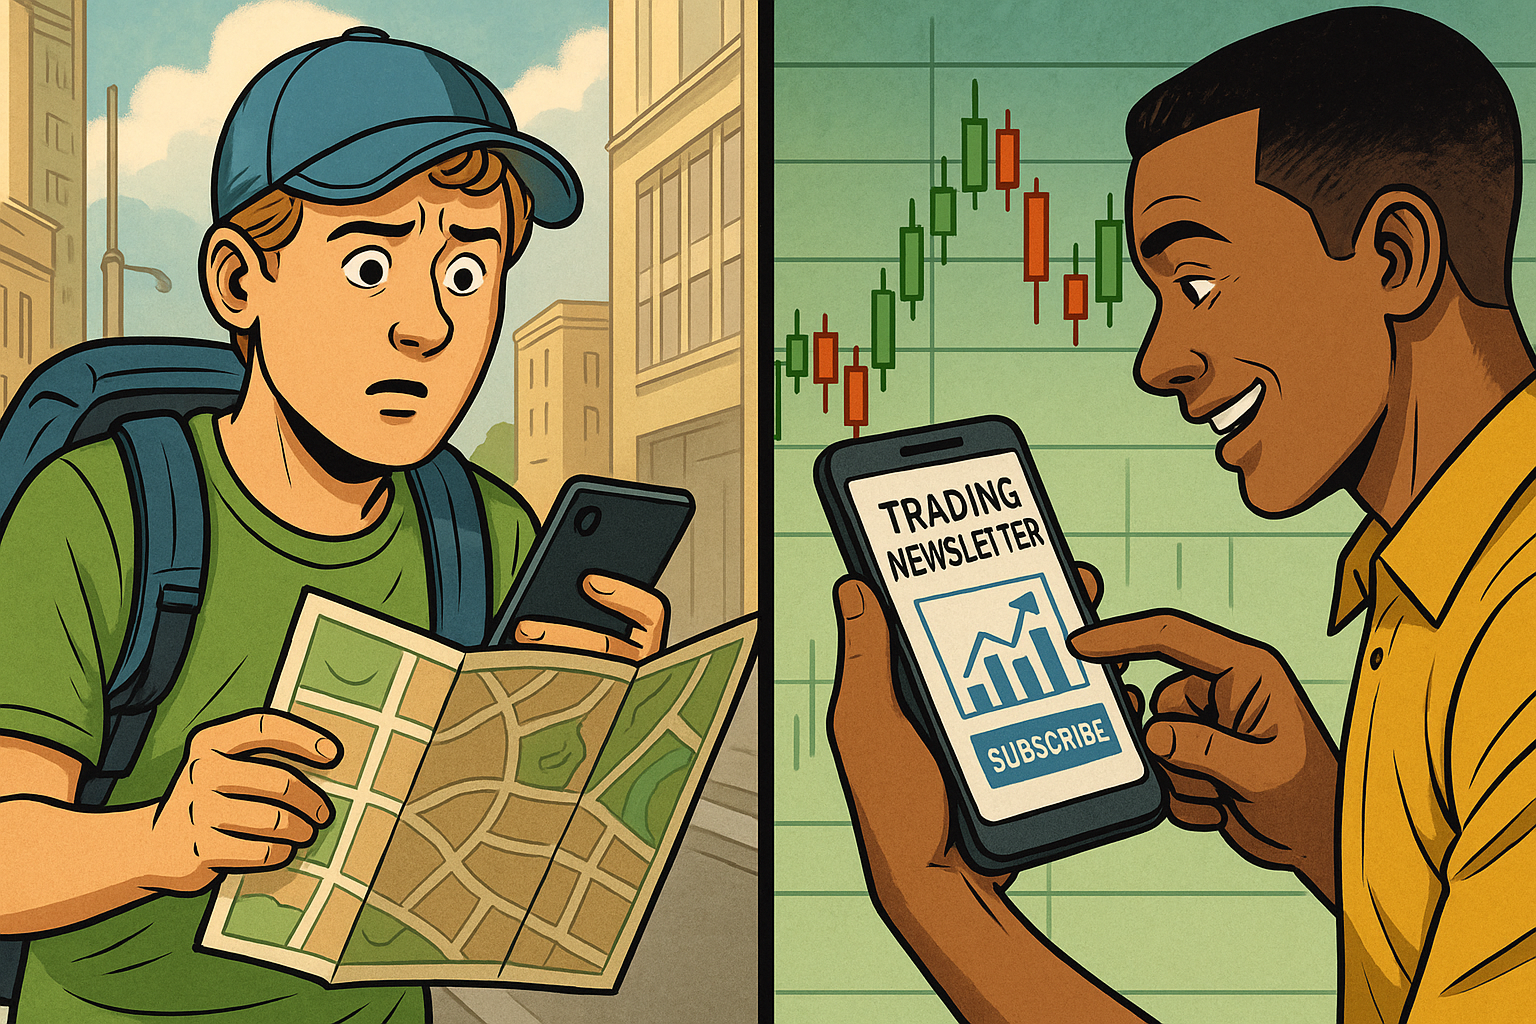
Wandering into the trading world without a guide is like stepping into a foreign city with no GPS, no translator, and no idea where the bathroom is.
It’s overwhelming, confusing, and full of wrong turns.
That’s why having access to reliable, experience-backed trading newsletters is a game-changer.
These newsletters act like your personal tour guide - showing you where to go, what to avoid, and how to make smart moves.
They break down strategies, highlight trends, and help you build confidence without falling into the traps of misinformation or hype.
If you’re tired of feeling directionless in the markets, these newsletters will point you to your trading North Star.
👉 Start here

Ascending Triangle

An Ascending Triangle is a bullish continuation chart pattern that forms during an uptrend, signaling that the price is likely to continue moving upwards after a period of consolidation. It's characterized by a flat upper trend line (resistance) and a rising lower trend line (support).
What to Look For:
- Flat Upper Trend Line (Resistance): This line connects a series of roughly equal highs.
- Rising Lower Trend Line (Support): This line connects a series of successively higher lows.
- Converging Trend Lines: The upper and lower trend lines converge, forming a triangle shape.
- Decreasing Volume: Trading volume typically decreases as the pattern forms, indicating a period of consolidation.
- Breakout Above Upper Trend Line: The pattern is confirmed when the price breaks decisively above the flat upper trend line (resistance) with a significant increase in volume.
- Bullish Continuation: The breakout suggests that the prior uptrend is likely to resume.
- Measured Move: The potential price target after the breakout can be estimated by measuring the height of the back of the triangle (the widest part) and projecting that distance upwards from the breakout point.

We all start with a dream.

The cars. The mansion.
The freedom to walk into any room, any store, any life -and never have to ask, “Can I afford this?”
That dream is powerful.
It’s the fire that gets you up early, keeps you studying late, and pulls you through losing weeks with clenched teeth and stubborn hope.
But here’s the catch no one talks about: The dream can also destroy you.😬
When it’s all you focus on, you start rushing. Forcing. Overtrading. You chase that “one big win” that’ll shortcut the grind—and that’s when discipline breaks, and drawdowns hit.
The vision is meant to drive you.But it’s the daily execution that gets you there.
So here’s your shift:
- Zoom out to stay inspired.
- Zoom in to stay consistent.
- Break the mansion dream into weekly wins. One strategy. One clean trade. One high-quality decision at a time.
Because the trader who makes it?Isn’t just dreaming big.
They’re building small - every damn day.
Keep the vision in focus.But keep your feet on the charts.


