Azul Flies 3400%
....................................................................................................................


Good morning.
It’s Friday - but the market’s been sleepwalking since Monday.
No setups, no juice, no action. Just vibes and sideways candles.
If you’ve been staring at your screen wondering, “Is this thing on?” - yeah, same here.
But just as the week was about to slide quietly into the weekend… 💥
A U.S. trade court ruled that President Donald Trump exceeded his authority in imposing most tariffs, effectively blocking them.
Before bulls could even celebrate, the government immediately appealed.
A federal appeals court has temporarily reinstated most of President Donald Trump's tariffs after they were invalidated by the U.S. Court of International Trade.
So now it’s back in legal limbo, and Wall Street’s stuck waiting (again) to see how this drama unfolds.
In the meantime? The market still isn’t moving like it owes anyone money.

📈 Nasdaq Roars as Trump Tariffs Blocked!
Nvidia’s earnings beat fuels Big Tech optimism. Court ruling torpedoes Trump’s trade agenda.
🛬 Azul's 3400% Spike After Bankruptcy Bombshell!
Retail chatter explodes after Azul files Chapter 11. Wall Street watches as $2B in debt gets wiped.
👑 “Godfather of AI” Beats Street Again!
Nvidia’s Jensen Huang shrugs off China chip hits. Retail sees $170 next stop.
🎤 Epic Mic Drop: $120K BTC?
A U.S. judge just torpedoed Trump’s tariffs. Now analysts say Bitcoin’s next leg is on — and greed is back in charge.
✋ Markets Pop as Trump Tariffs Blocked
Dow Up 400+ after court blocks tariffs, Wall Street cheers rare court smackdown. Tech rallies hard on Nvidia’s AI momentum.
🛢️ Oil Prices Surge as Court Blocks Trump Tariffs
Brent crude jumps over $65 as trade war fears ease. Supply risks from Russia and Venezuela keep markets on edge.
📉 Trump Tariff Block Sends Gold Lower
Bullion slips as U.S. dollar strengthens post-court ruling. Investors eye inflation risks and Fed signals ahead.

Cadence Design Systems (NASDAQ: CDNS) – TP2 Hit, Trade Closed
This setup was as sharp as they come.
We entered a sell at $307.86, after spotting a textbook topping pattern with triple rejection and RSI diving off a cliff.
The chart was screaming reversal - and we listened.
What followed? A clean breakdown.
TP1 at $299.48 came quickly.
Then momentum picked up speed and TP2 at $289.53 was smashed without hesitation.
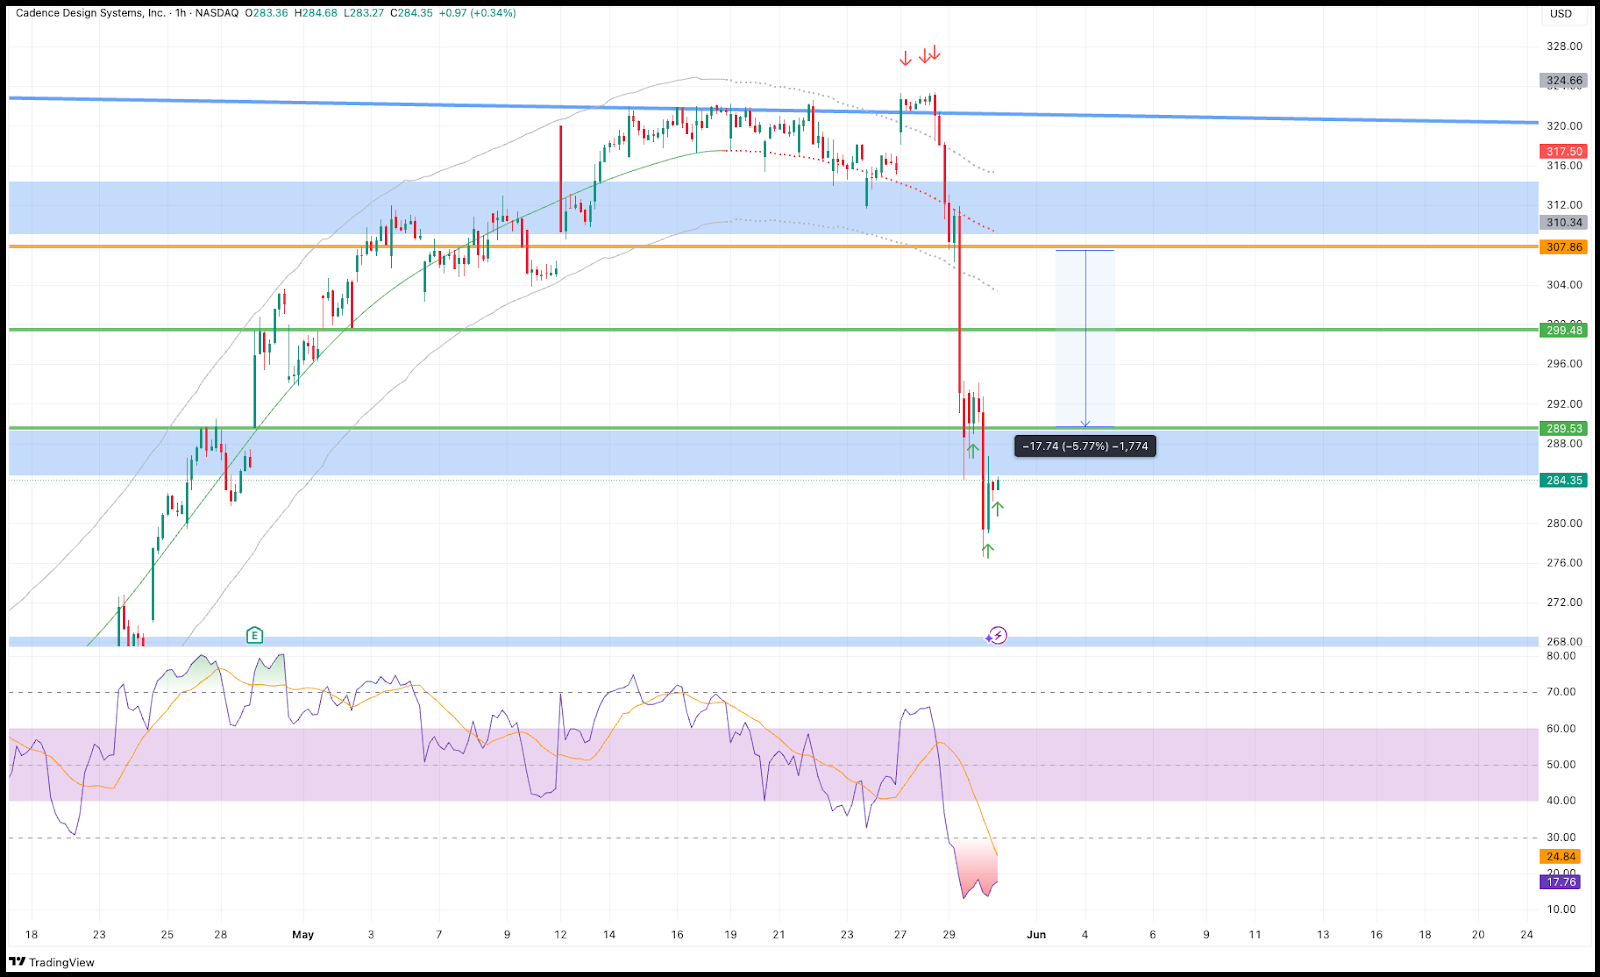
I’ve closed the entire trade - with prices continuing to fall even after both targets.
That’s a 5.77% win before leverage.
Way to go!

The Only Thing Illegal Is Letting Fear Stop Your Trades

Taxes. Regulations. Paperwork. For many traders, it's not the market that scares them - it’s the fear of getting it wrong with the IRS.
But here's the truth: most of that anxiety comes from not knowing what’s actually required.
These newsletters break down the “scary stuff” into simple, actionable insights so you don’t have to be a tax expert to trade responsibly.
You’ll learn the basics of tax-efficient trading, what rules really matter, and how to keep things legal without losing sleep (or profits).
If tax fears are stopping your trades cold, these newsletters will show you how to move forward with clarity and confidence:
👉 Click here to read them now.

ADX (Average Directional Index)

The Average Directional Index (ADX) is a technical analysis indicator that measures the strength of a price trend, rather than its direction.
It is typically used alongside two other lines, the Positive Directional Indicator (+DI) and the Negative Directional Indicator (-DI), which indicate the trend's direction.
What to Look For:
- ADX Line (Trend Strength):
- Rising ADX: Shows the trend is getting stronger, whether it's going up or down. A move from below 20 to above 25 often signals a strong trend starting.
- Falling ADX: Shows the trend is getting weaker or the market is consolidating (moving sideways). This means momentum is slowing down.
- ADX Values:
- Below 20-25: Suggests a weak or no clear trend.
- Above 25: Suggests a strong trend is in place.
- Above 50: Points to a very powerful trend.
- +DI and -DI Lines (Trend Direction):
- +DI Above -DI: Indicates a bullish (upward) trend.
- -DI Above +DI: Indicates a bearish (downward) trend.
- Crossovers:
- +DI crossing above -DI: Can be a signal to buy, as buying pressure is increasing.
- -DI crossing above +DI: Can be a signal to sell, as selling pressure is increasing.
- Using ADX with +DI and -DI (Combined Signal):
- If ADX is rising AND +DI is above -DI, it confirms a strong uptrend.
- If ADX is rising AND -DI is above +DI, it confirms a strong downtrend.
- If ADX is falling, the current directional move is losing steam, even if one directional indicator is dominant.

When Knowledge Costs You
There’s no pain quite like watching the money pass you by.
You saw the setup.
You felt the move.
But you couldn’t take it — because you didn’t know enough to act.
That’s the part that stings.

Not just the missed profit…But the helplessness of not being prepared when the market spoke.
Meanwhile, someone else — same chart, same candle - caught it clean.
Not because they were lucky, But because they were ready.
They put in the work.
They studied.
They sharpened their tools when nothing was moving - So when it did, they moved with it.
That’s the reality:
Opportunities don’t wait. They reward those who already know what to do.
So if you’re chasing the money, Start chasing knowledge harder.
Because when the next chance comes, Tears won’t bring it back - but preparation will take you forward.
Let the pain remind you: The market doesn’t pay wishers. It pays workers.