Amazon Meta charge
....................................................................................................................


Rise and grind, traders!
It’s Wednesday and the markets are lit this morning 🔥
We’re only halfway through the week and already seeing fireworks:
Global stocks launched Monday after the U.S. and China hit pause on their trade war - slicing tariffs for 90 days.
That truce?
It sent the Dow flying over 1,200 points, with Amazon, Apple, and Nike leading the charge like it’s earnings season on steroids.
Bitcoin? Yeah, it just flexed past $100K for the first time in months - riding the momentum from Trump’s new U.S.-UK trade deal.
Meanwhile, Wall Street’s rally is still holding steady. The S&P 500’s officially erased all of 2025’s losses, with futures ticking up again across the board.
Asian markets? Mixed at open, but mostly green as the trade war smoke clears.
Whether you’re chasing that crypto breakout, riding momentum in U.S. equities, or watching the forex charts - we’ve got your morning market fuel right here.

💤 Calm Before the CPI Storm
Markets cooled off after a monster Monday rally—futures dipped as traders hit pause ahead of key inflation data and earnings. But don’t let the breather fool you… bulls still see blue skies if CPI comes in tame.
🍂 Futures Fade Ahead of CPI
Markets cool off after Monday’s rally, with Dow and Nasdaq futures dipping as traders await key inflation data. The tariff truce euphoria fades as investors eye CPI for signs of price pressure from Trump’s trade war.
🤖 Amazon, Meta Power Tech Rally
Amazon and Meta lead a “Magnificent Seven” surge as US and China agree to a 90-day tariff truce. Big Tech rebounds sharply after losing $2T in April, with Tesla topping $1T and Nvidia nearing $3T again.
🚀 Bitcoin Nears ATH After $312M Whale Move!
Over $312M in BTC just vanished from Binance - right as the US-China trade truce hit headlines. Bitcoin’s back on the brink of a breakout, and the timing couldn’t be more suspicious.
⏸️ World Markets Pause as Trade Euphoria Fades
After Monday’s rally, the thrill is gone - investors hit pause. Will the U.S.-China truce hold, or is this another calm before the storm?
⤵️ Oil Slips as Supply Concerns Outweigh Trade Deal Boost
Oil retreats 0.3% to $64.74, with rising supplies overshadowing the temporary relief from the US-China trade truce. Will the market stay volatile?
📀 Gold Flat as Tariff Truce Fades
Gold sticks at $3,235 as US-China trade relief cools. Traders now eye inflation data for the next big move.

Trade Updates:HP Inc. (NYSE: HPQ) – Trade Closed at a Loss (Our first one)
In our earlier update, we mentioned adding a second position in HP at $28.63.
At the time, price had pulled back but was still holding structure, and we stuck to the plan.
But the recovery never came.Instead of bouncing, HP continued to drift, showing weak momentum despite a decent setup.
It’s been 2 months and the market gave us no reason to stay in, and with no bullish follow-through, I made the call to close the position at $28.78.
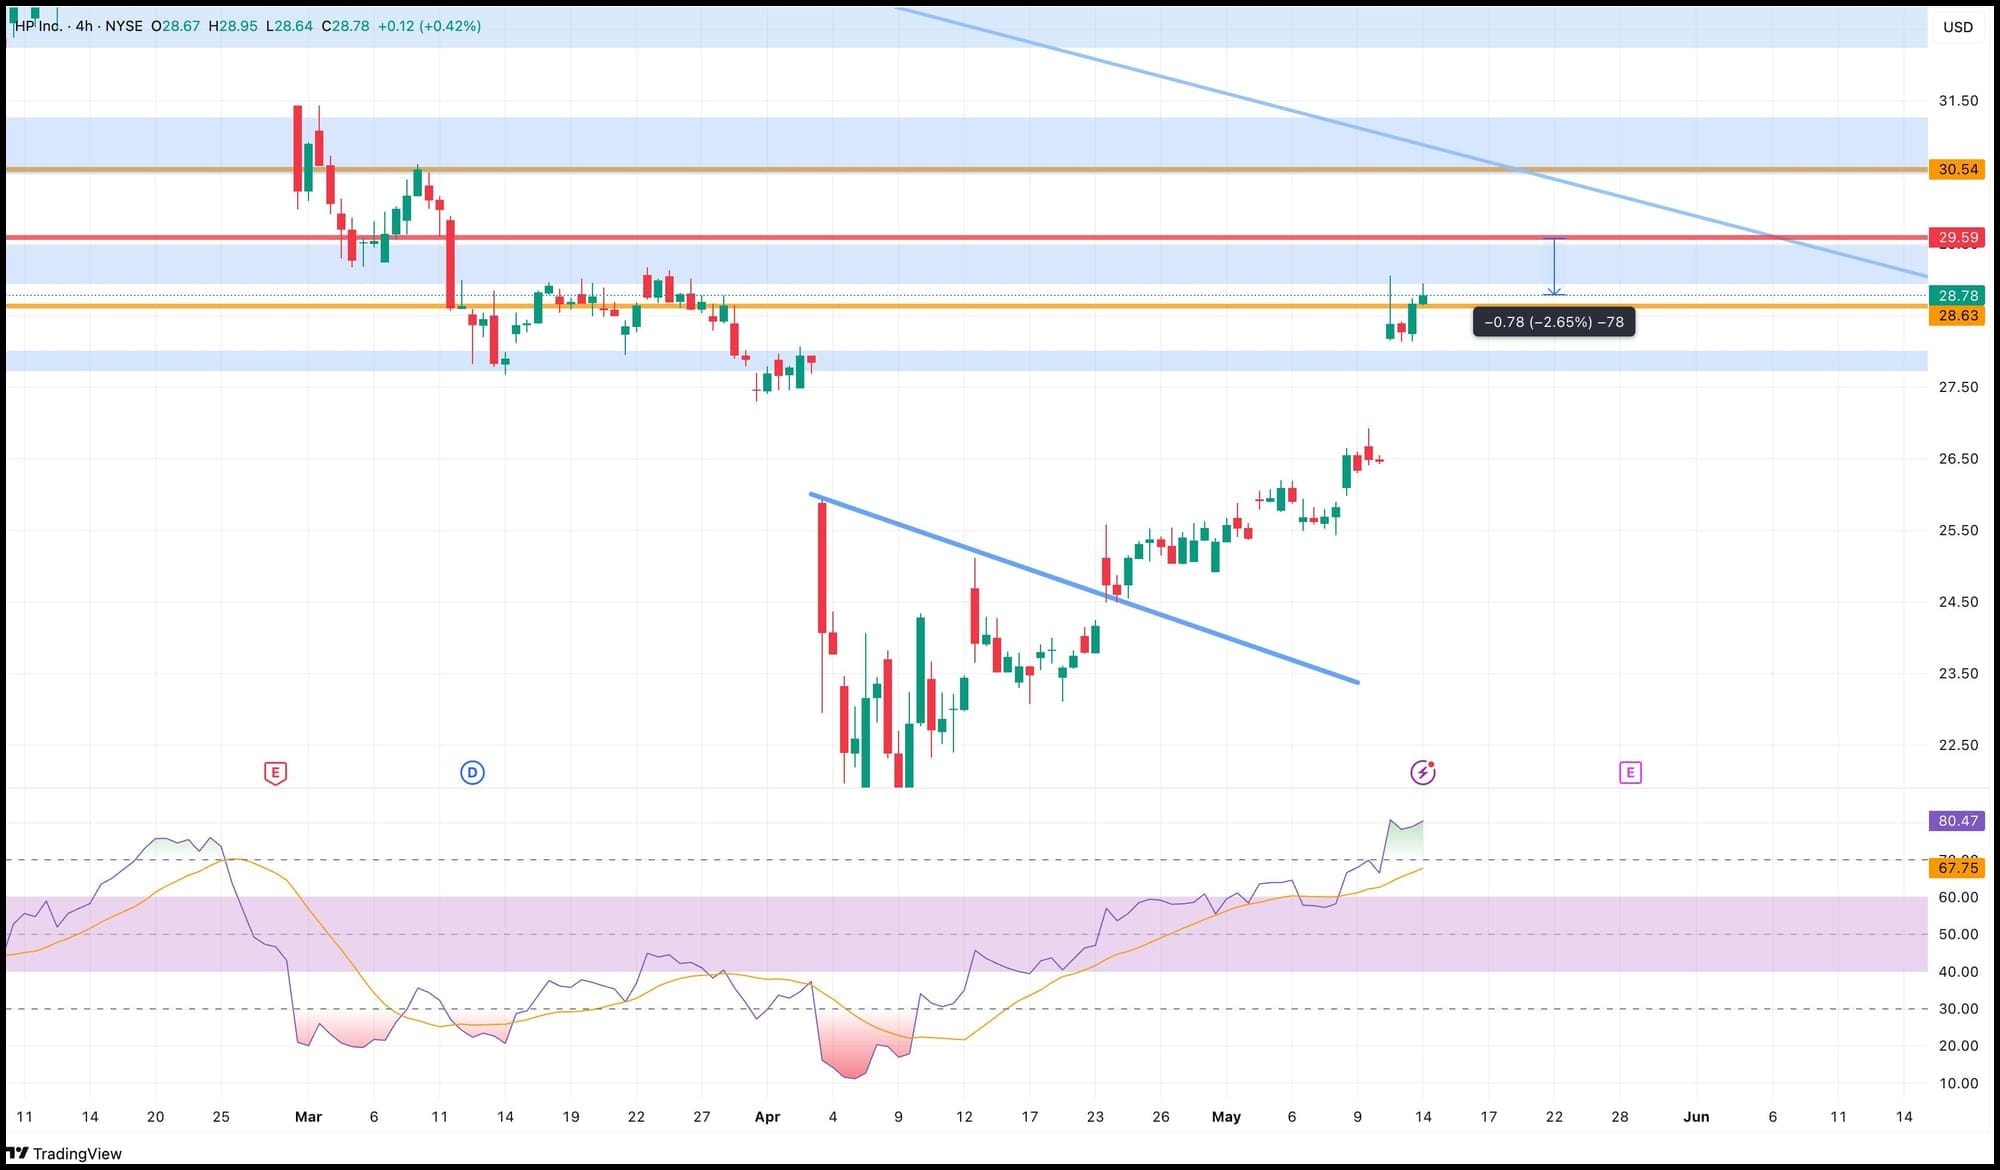
That locks in a loss of 2.65% before leverage.
It’s our first loss since starting this Winning Stocks Section.
I know it stings a little but this is part of the game.
We don’t chase. We don’t hope. We manage.
This one didn’t follow through - and we moved on.
However, while HP didn’t play out as planned, three other stocks stepped up and delivered clean wins.
A strong reminder that it's not about being perfect, it's about staying consistent.
Let’s break down those wins next. 📈🔥
SAP SE (NYSE: SAP) – TP1 Hit
While HP didn’t work out, SAP came through just as we planned.
We entered a sell at $297.67, anticipating a clean pullback after price started showing signs of exhaustion at the top.
Not long after, SAP broke down and hit TP1 at $286.98, locking in a solid 3.50% gain before leverage.
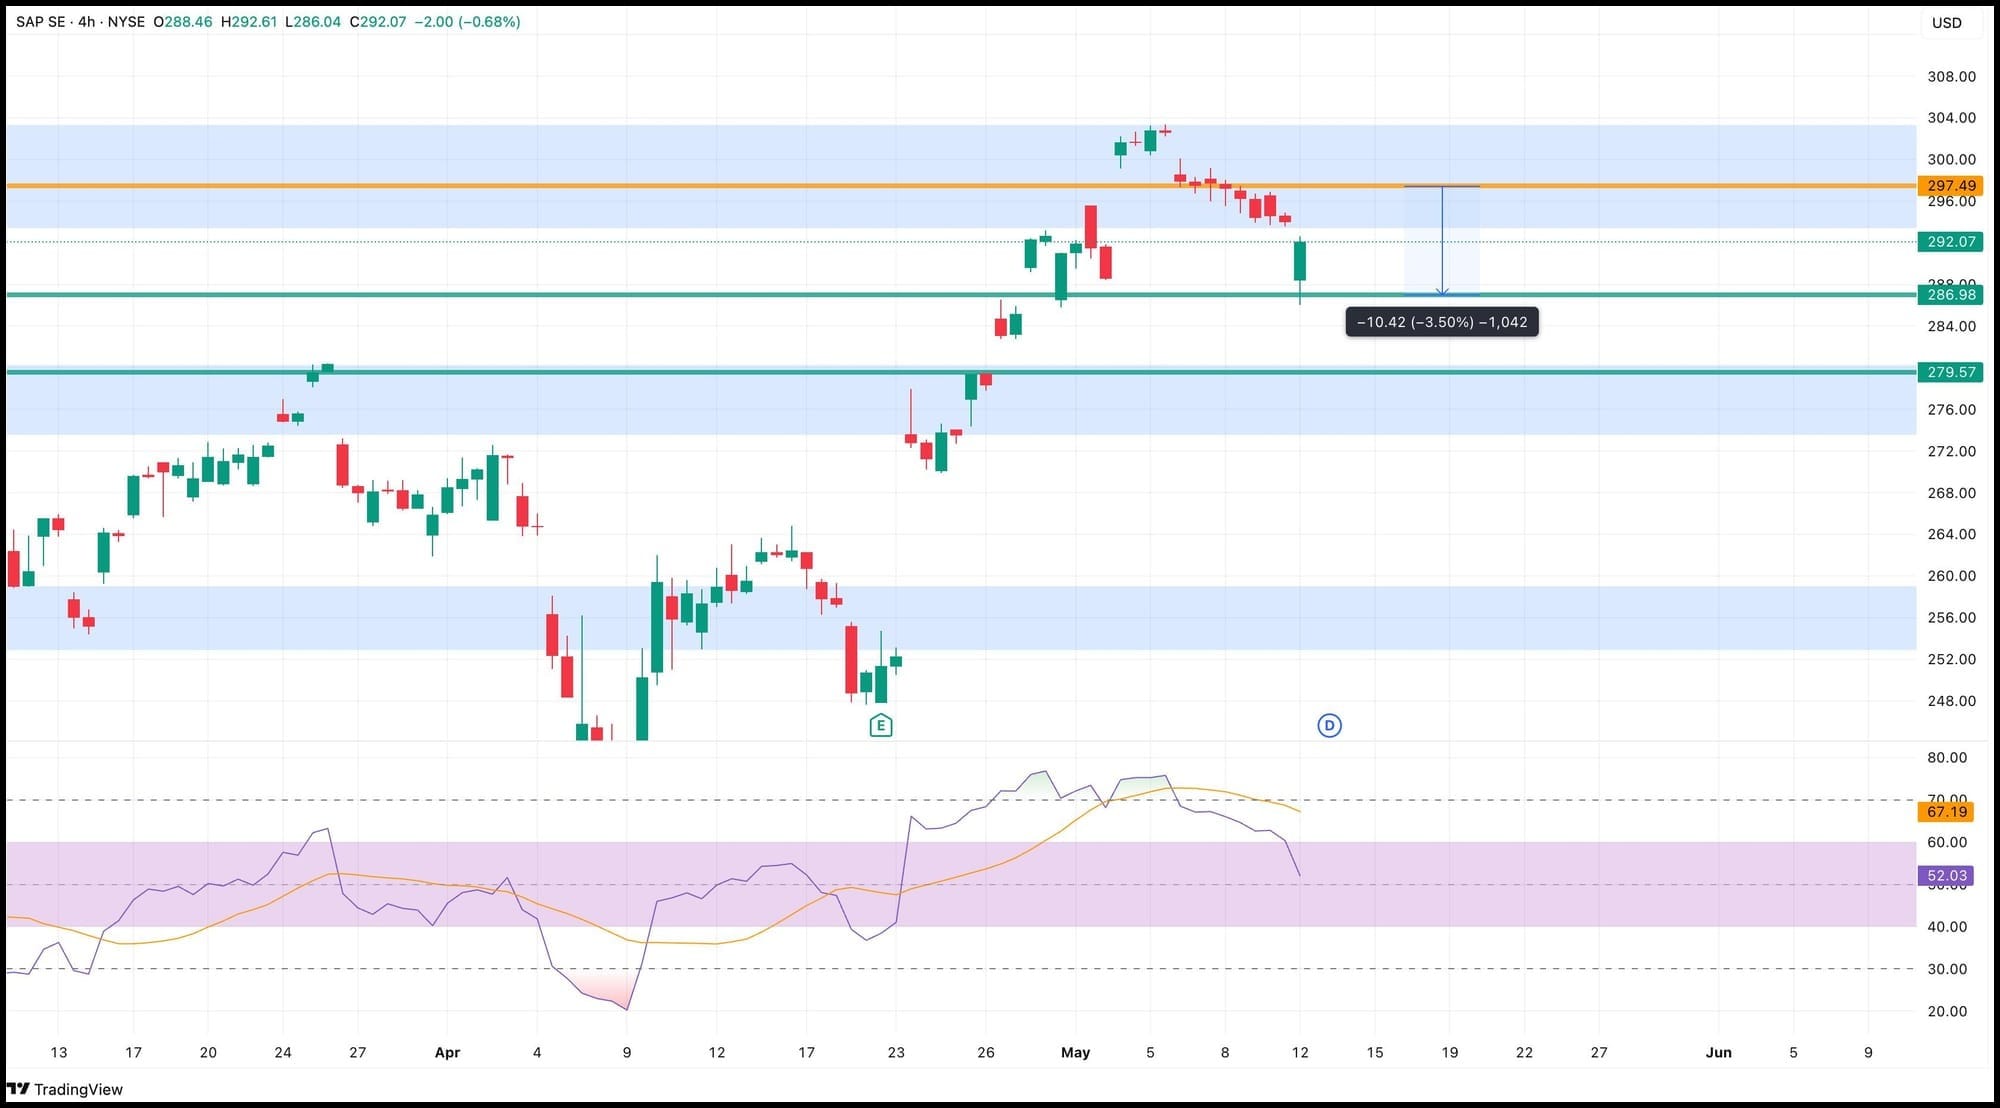
The candles told the story early - stalled momentum, fading strength, and a clear RSI shift.
We read it right. We executed. We banked the win.
Another textbook setup that rewarded discipline and timing.
Netflix Inc. (NASDAQ: NFLX) – TP1 Hit
We spotted the cracks before the drop.
Netflix had been floating near its highs, but the chart told a different story.
Price was stalling, and RSI was already rolling over.
That’s when we entered a sell at $1144.43, positioned for a sharp pullback.
Although it didn’t hit our TP1 at $1095.12, the momentum was strong enough early on, and I made the decision to lock in profits ahead of target.
We closed the position at $1111.48, banking a 3.27% gain before leverage.
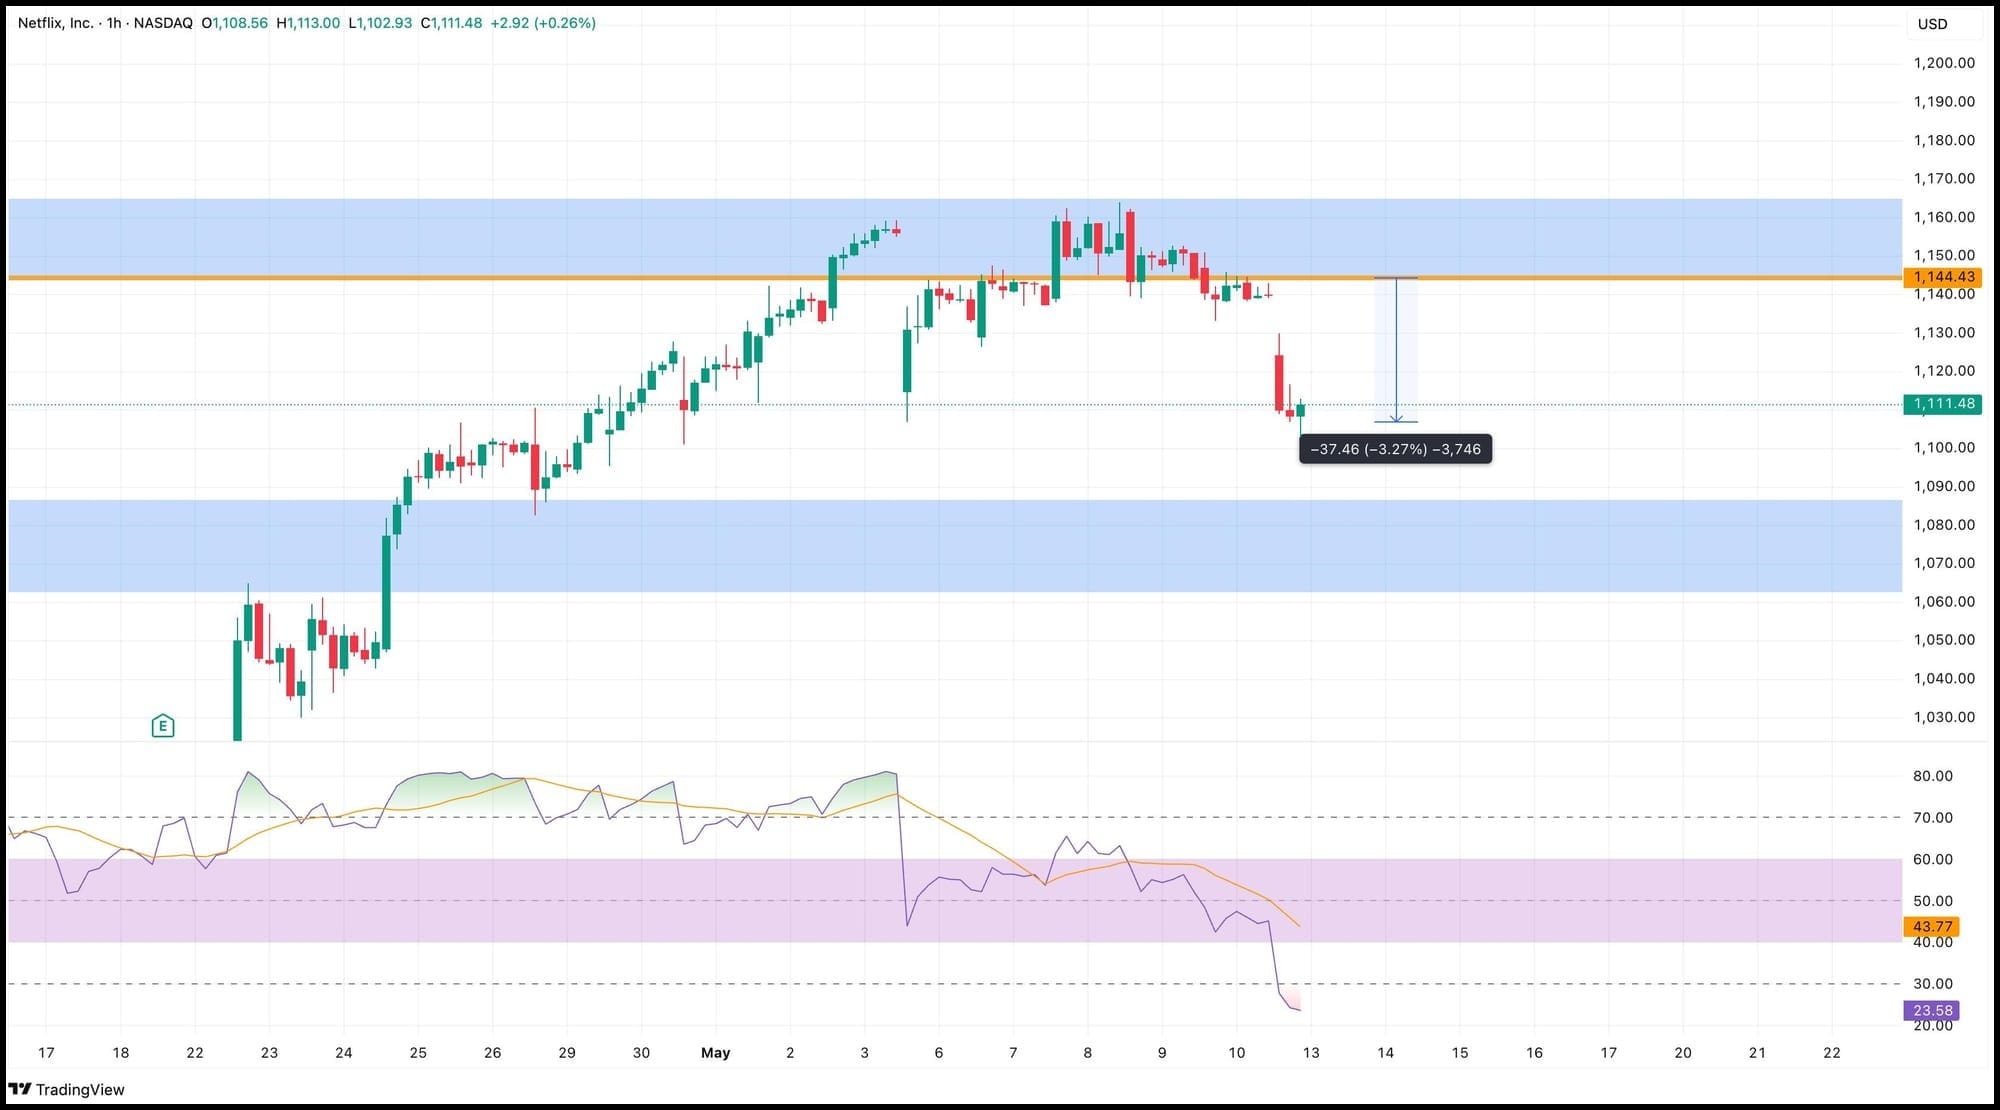
A high-conviction setup. Clean breakdown. Fast follow-through.
Smart exit. Solid gain. 📉🎯
Chevron Corp. (NYSE: CVX) – TP1 Hit
We spotted early signs of strength as Chevron quietly built momentum off its base.
We entered a buy at $137.29, just as price was starting to climb out of consolidation.
It wasn’t a flashy breakout—but it was clean, calculated, and supported by rising RSI.
And it paid off.
Chevron hit our TP1 at $143.26, banking a 4.35% gain before leverage.
This was all about reading the buildup - no hype, just structure and timing.
A solid win to wrap the week strong.

If “Where Do I Start?” Is Your Daily Question, We’ve Got Answers

You’re eager to trade - but stuck at square one. Should you jump into forex? Try crypto?
Play with options or stick to stocks? That overwhelming uncertainty is enough to keep anyone frozen.
Here’s the fix: curated trading newsletters that do the heavy lifting for you.
These newsletters break down the pros and cons of different markets, highlight where the real opportunities are right now, and guide you toward what actually fits your risk level, schedule, and goals.
No more second-guessing or chasing trends blindly. You’ll get insight from traders who’ve tested it all - and know what works.
If you’re tired of guessing your way through trading, these newsletters will give you the guidance you need to move forward with confidence.
The guidance to start is here, get in!

Rectangle

A Rectangle is a continuation chart pattern that forms during a trend as a period of sideways price action between two parallel horizontal trend lines (support and resistance).
It indicates a temporary equilibrium between buying and selling forces before the price typically continues in the direction of the preceding trend.
What to Look For:
- Two Parallel Horizontal Trend Lines: The price oscillates between a clear upper resistance line and a clear lower support line.
- Sideways Price Action: The price moves horizontally within the defined range of the rectangle.
- Consolidation: The rectangle represents a period of consolidation where buyers and sellers are in relative balance.
- Decreasing Volume: Volume often tends to decrease during the formation of the rectangle.
- Breakout: The pattern is confirmed when the price breaks decisively above the upper resistance line (bullish continuation) or below the lower support line (bearish continuation) with a noticeable increase in volume.
- Continuation of Prior Trend: The breakout typically signals that the price will continue in the direction of the trend that was in place before the rectangle formed.
- Measured Move: The potential price target after the breakout can be estimated by measuring the height of the rectangle and projecting that distance from the breakout point in the direction of the breakout

We Stopped Rushing - And Started Winning
Trading broke us.
Not because it was too hard - but because we expected it to be easy.
We treated it like a side hustle, not a serious craft.

We thought a few YouTube videos and chart patterns would be our fast pass to riches.
Instead? Account after account… wiped out. Confidence?
Shaky. And that dream of “financial freedom”?
Fading quick.
Until one mindset shift changed everything.
We stopped rushing the money… and started studying the game.
Not like a get-rich-quick scheme.Like a real degree.
Think med school.
Nobody becomes a doctor by accident. It takes years of discipline, late nights, sacrifice, and the understanding that there are no shortcuts. And most med students?
They’re not even guaranteed big money at the end - they’re in it because they care.
That’s the mindset we brought into trading. And that’s when everything started to click.
Here’s what we changed:
🔹 We stayed on demo for six months. Not playing around - full focus. Same equity we’d use live, 1% risk, no shortcuts. We practiced like it was the real thing. Because it was.
🔹 We journaled every day. Not just the trades - the emotions. What triggered us? Where did we hesitate? What felt off? Our journals became maps to our mindset. And it helped us grow faster than any course.
🔹 We read every psychology book we could find. Mark Douglas changed our whole view of the market. We stopped trying to be right… and started trusting our edge.
🔹 We stopped talking and started working. No more explaining our trading to doubters. No more pressure to post wins. We made peace with the silence - and that peace gave us focus.
When we finally gave up the need to “make it fast”… The withdrawals came slow and steady. And they stayed.
Because we weren’t gambling anymore.
We were trading like professionals.
So if you’re stuck, stressed, or spinning in circles - maybe it’s not your system. Maybe it’s your mindset.
📍 Trade like it’s med school.
📍 Study like it’s your life’s work.
📍 Be okay with not earning while you’re still learning.
If that resonates, you’re one of us.
We built this newsletter for traders like you - the ones ready to stop chasing noise and start doing the real work.
Every week, we break down the market, drop psychology gems, and share raw, relatable lessons from the grind.