
All eyes on fed
....................................................................................................................


Good morning Traders,
Wall Street started the week in a cautious green.
Futures ticked higher early Monday with traders already eyeing Wednesday’s Fed meeting, where a quarter-point rate cut looks like a done deal.
The backdrop is bullish.
The Nasdaq just closed out back-to-back record weeks, the S&P had its best run since August, and even the Dow shook off losses to finish higher.
Now, with weak labor data and sticky prices tilting the odds, Fed funds futures are putting a 96% chance on a cut and whispers of more before year-end.
The AI trade is still humming, but the bubble talk is getting louder.
FedEx steps up this week with earnings that could set the tone for global growth, while Cracker Barrel’s rebrand is on watch as a consumer sentiment test.
Traders are playing it light into Monday, but the stage is set for fireworks midweek.

❄️ Stocks Cool as Fed Cut Seen Locked In
Futures slip after Dow’s first close above 46,000. Markets now bet on as many as three cuts by year-end, even as inflation lingers from Trump’s tariffs.
🌊 Global Stocks Ride Fed Cut Wave
Wall Street highs fuel Asia and Europe into the weekend. With labor market cracks and tame inflation, traders say the first 25bps cut is all but locked in.
📈 Wall Street Indexes High, Bulls Feast on Tech and Fed Hopes
Micron gets a Citi upgrade, Tesla extends its rally, and semis notch new highs. Sticky inflation doesn’t stop futures from pricing a September cut.
💻 Nvidia Partner Super Micro Stock Pops
Super Micro unveils Blackwell Ultra platforms, including HGX B300 and GB300 NVL72, sparking bullish FOMO. Stocktwits chatter keeps it among the top trending tickers overnight.
🪙 Bitcoin, XRP, Ether Climb On Fed Rate-Cut Hopes
Crypto traders are piling in as inflation steadies and the Fed readies a cut. Ether and XRP ride the wave, while Solana and Dogecoin steal the week’s spotlight.
💰 Bitcoin Reclaims $115K As Derivatives Fuel Recovery
BTC fights to hold its ground as futures traders absorb sell pressure. The real test looms at $116K–$121K, where resistance could make or break the rally.
💸Google Bulls See $300 On The Horizon
Evercore hikes its Street-high target as AI, Cloud, and YouTube fuel momentum. A favorable Chrome ruling clears the overhang, leaving Alphabet free to flex.

No new recommendations for today.
Current setups are still playing out, and we’ll let them run without forcing fresh entries.
Patience is part of the edge.
I’ll share the next moves when the charts line up.

Get-Rich-Quick is the Fastest Way to Get-Broke-Quicker
New traders walk in with dollar signs in their eyes.
One trade, one week, one “hot tip” that’ll flip their account into a fortune.
That mindset kills more accounts than bad setups ever do.
Trading isn’t a lottery ticket. It’s a process.
The traders who stick around don’t aim for overnight riches - they aim for consistent gains that add up over time.
Slow, steady growth might sound boring compared to the hype, but boring is what pays.
Newsletters help cut through the noise.
They show you what realistic trading looks like, with strategies built for steady progress instead of pipe dreams.
No magic formulas. No “double your money by Friday.”
Just clarity, discipline, and direction.
👉 Get-rich-quick is the fastest way to get-broke-quicker.
Start building real progress here.

Sine Wave Indicator
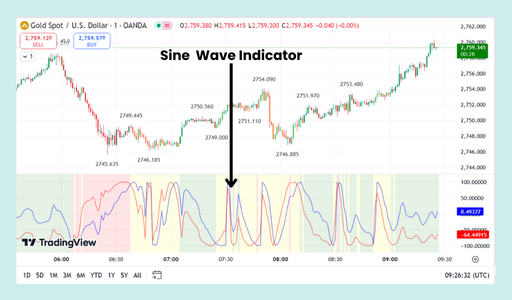
The Sine Wave Indicator, also known as the MESA Sine Wave, is a technical analysis tool that identifies market cycles and potential reversal points.
Developed by John Ehlers, it uses advanced mathematical concepts from digital signal processing to help traders understand whether a market is in a trending phase or a cyclical (ranging) phase.
The indicator consists of two lines: a Sine Wave line and a Lead Wave line.
What to Look For
- Two Lines: The indicator plots two lines, a Sine Wave line and a Lead Wave line. The Lead Wave is a moving average of the Sine Wave line, which makes it a slightly faster signal.
- Crossovers: The most common trading signal is generated when the two lines cross.
- Bullish Crossover: A buy signal occurs when the Sine Wave line crosses above the Lead Wave line.
- Bearish Crossover: A sell signal occurs when the Sine Wave line crosses below the Lead Wave line.
- Cyclical vs. Trending Markets: The indicator helps distinguish between a ranging and a trending market.
- Cyclical/Ranging: When the two lines are moving in a smooth, wave-like pattern and crossing frequently, it indicates that the market is in a cyclical or ranging phase. This is where the indicator is most effective.
- Trending: When the two lines run parallel to each other and stop crossing, it suggests the market is in a trending phase. In this condition, the indicator is not effective for generating crossover signals.
- Overbought and Oversold Conditions: The indicator's peaks and troughs can be used to identify potential market tops and bottoms. When the wave is at a peak, it may indicate an overbought market, while a trough may suggest an oversold market.
- Lag: As the indicator uses a moving average, it has some lag. Traders often use it in conjunction with other indicators to confirm signals.

Every trader knows the setup I’m talking about.
You’ve done the homework.
You marked the levels, spotted the liquidity pool, confirmed the confluence.
Everything lines up. This is the trade. The one you waited hours, maybe days for.
But when it’s time to click BUY or SELL… nothing happens. Your finger hovers.
Your mind starts running a highlight reel of every losing trade you’ve ever taken. You’re frozen.

That’s fear disguised as caution. It’s what we call analysis paralysis.
The market doesn’t wait for you.
While you’re hesitating, price makes its move. And instead of riding it, you’re stuck watching it go without you.
Then comes the worst part - regret.
That hollow feeling when you realize the setup worked exactly as you planned, but you never trusted yourself enough to act.
This is where traders separate themselves.
The pros understand something simple: hesitation will cost you more than a losing trade. Because every time you hesitate, you reinforce the habit of doubt.
And every time you execute, even if it’s a scratch or a small loss, you reinforce belief in your process.
Fear is sneaky.
It convinces you that waiting is safer, but all it really does is rob you of opportunity.
The way forward isn’t to chase every move recklessly, it’s to take the trades you already know fit your plan and accept the outcome with discipline.
Here’s the truth no one likes to admit:
- The setup isn’t the problem.
- Your analysis isn’t the problem.
- Your inability to act is the problem.
And the only cure for that is execution.
Small size, tight risk, but execution nonetheless. You’ll never think your way out of fear. You have to act your way out of it.
Next time you catch yourself frozen, ask: is fear taking this trade for me? Or am I stepping in with the conviction I built from my prep?
The market rewards action, not hesitation.


