
Alibaba Falls 3%
....................................................................................................................


Good morning — here’s your tight market pulse before the open 📊
Risk sentiment is mixed today as geopolitics, AI fears, and cross-asset volatility keep traders rotating instead of committing.
Chinese tech slipped after a brief Pentagon blacklist scare rattled confidence. Alibaba Group fell about 3%, while BYD and Baidu lost around 1% before the listing was withdrawn.
The message: headline risk around China exposure is back on traders’ radar.
Gold pulled back under $5,000 after a strong inflation-driven run, sliding on profit-taking rather than panic.
Safe-haven demand is still there — positioning just got crowded.
The AI sell-off is spreading beyond software into logistics, transport, and wealth platforms. This is shifting from valuation reset to business-model repricing.
Crypto flipped risk-on at the edges:
Dogecoin jumped nearly 20%, outperforming Bitcoin and Ethereum on fresh corporate buying.
Asia traded flat on weak Japan data, the yen softened, the dollar held steady, and oil hovered near $67 as traders watched US–Iran talks and OPEC+ signals.
Find more details in the crucial updates section.

🇨🇳 Alibaba Drops 3% After Pentagon Blacklist Scare
Chinese tech stocks slid after the Pentagon briefly listed firms like Alibaba Group, BYD Co., and Baidu as military-linked. Alibaba fell 3%, while BYD and Baidu dropped about 1% before the list was quietly withdrawn.
🥇 Gold Slips Below $5,000 After 2.4% Rally
Gold fell as much as 1.5%, dropping back under $5,000/oz after a 2.4% jump on mild inflation data sparked profit-taking.
🤖 AI Sell-Off Spreads Beyond Tech
Wall Street fears over AI disruption widened beyond software into logistics, wealth management, and transport — sparking multi-sector selling pressure.
🐕 Dogecoin Surges 19% as Corporate Buyers Step In
Dogecoin jumped nearly 20% in 24 hours, pushing its market cap close to $19B, outperforming Bitcoin, Ethereum, and Solana.
🌏 Asia Stocks Flat as Japan Data Disappoints
Asian markets stayed muted due to holidays and weak Japanese economic data, while traders waited on U.S. GDP and global PMI releases.
💴 Yen Softens After Strong Week
The yen eased after recent gains as traders reassessed global rate expectations, while the dollar held steady ahead of key economic data.
🛢️ Oil Drifts Near $67 Ahead of U.S.–Iran Talks
Brent crude hovered around $67.72 per barrel, moving slightly lower as investors watched U.S.–Iran nuclear talks and possible OPEC+ output hikes.

Waiting Is a Strategy
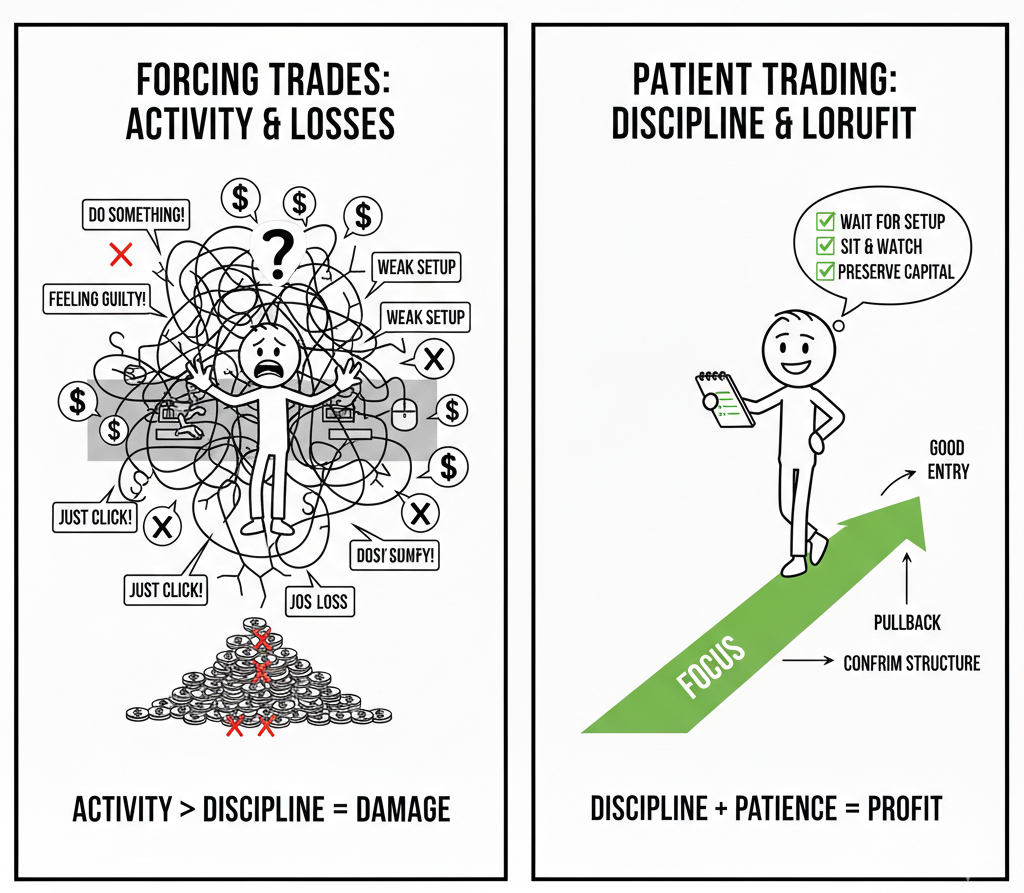
Doing more trades does not mean making more money. Trading all day often means forcing weak setups. Many traders feel guilty when they sit and watch, so they click into trades with no clear reason.
That’s where the damage starts. Small losses stack up. Confidence drops. Good setups get missed because the account is already tired. Activity replaces discipline.
Strong traders accept quiet periods. They wait for price to reach their levels. They enter when rules are met. They skip trades that don’t fit the plan.
When you learn to wait, your trades improve. Your mind stays calm. Your results become more consistent because every trade has a reason behind it.
Patience protects your edge.
If you want trading guidance that teaches you when to act and when to stay out so you avoid overtrading and keep your plan clear, these newsletters help. They focus on discipline, timing, and steady progress.

Shooting Star
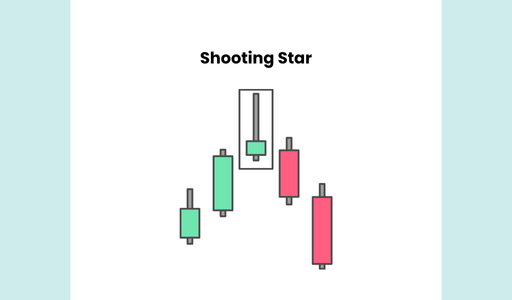
The Shooting Star is a bearish reversal pattern that appears at the peak of an uptrend. It is the visual opposite of a Hammer.
It consists of a small body at the lower end of the candle with a long upper wick.
It tells the story of "Buyer Exhaustion"—it shows that bulls tried to push the price to new highs, but were met with a massive wall of selling that forced the price back down toward the open, leaving everyone who bought the top "trapped."
🛠️ The Strategy Logic
Use these logical triggers to identify when a rally has reached its limit and a crash is imminent:
- IF: The upper wick is at least two to three times the length of the candle body...
- THEN: The signal is valid. This long wick represents a "rejection" of higher prices and proves that the bears have enough power to overwhelm the bulls' momentum.
- THEN: The signal is valid. This long wick represents a "rejection" of higher prices and proves that the bears have enough power to overwhelm the bulls' momentum.
- IF: The Shooting Star forms after a sustained rally or near the Upper Keltner Channel...
- THEN: The reversal probability is high. The market is overextended, and this specific candle shows the exact moment the "buying fuel" ran out at the ceiling.
- THEN: The reversal probability is high. The market is overextended, and this specific candle shows the exact moment the "buying fuel" ran out at the ceiling.
- IF: There is a "gap up" between the previous candle and the Shooting Star...
- THEN: This is a "Blow-off Top" signal. The gap represents the final greedy push by retail traders, which is immediately met by institutional selling (distribution).
- THEN: This is a "Blow-off Top" signal. The gap represents the final greedy push by retail traders, which is immediately met by institutional selling (distribution).
- IF: The next candle closes below the low of the Shooting Star’s body...
- THEN: The bearish reversal is confirmed. This is the official "trigger" for a short entry or to exit a long position, as it proves the bears are maintaining their new control.
- THEN: The bearish reversal is confirmed. This is the official "trigger" for a short entry or to exit a long position, as it proves the bears are maintaining their new control.
- IF: The volume on the Shooting Star day is significantly higher than the previous green days...
- THEN: The signal is high-conviction. High volume on a rejection candle suggests that "big money" players are using the high prices to liquidate their positions.
💡 Pro Tip
The "Trap" Identification: The real power of a Shooting Star is the "supply" it creates.
Everyone who bought during that long upper wick is now at a loss. As the price starts to drop, those people will be forced to sell to limit their losses, which adds more selling pressure to the market.
If you see a Shooting Star followed by an Evening Star, you are looking at one of the most reliable "Sell" signals in technical history.

The Plan Drift
Picture this.
You built your trading plan on a calm weekend. Charts open. Coffee ready. Rules clear.
Entries defined. Stops fixed. Targets mapped.
Everything makes sense when no money sits on the line.
Then live trading starts.
Nothing changes on the document. Everything changes in execution.
You start five minutes earlier because the move “looks ready.”You widen one stop because price is “still valid.”You move one target because momentum “feels strong.”
Each decision sounds reasonable.
Together, they create a different system.
Here is the main problem.
Your results now come from a strategy you never tested.
Plan drift hides because it feels smart. It speaks in small adjustments. It avoids big rule breaks. That is why traders miss it.
Use a simple guardrail.
- Before the session, read your rules out loud.
- During the trade, write entry, stop, and target before you click.
- After the close, grade the trade with one mark only. Followed plan or did not.
No stories. No context. Just truth.
Your edge fails slowly, then all at once.
Keep your plan fixed so your data stays honest.


