
AI Market Drops
....................................................................................................................


Good morning traders,
US stock futures are struggling to find direction after a sharp, AI-driven sell-off rattled multiple sectors, and the market is now in wait-and-see mode ahead of the latest CPI inflation reading.
Futures on the S&P 500 are flat, the Nasdaq 100 is slightly positive, and the Dow is edging lower — a setup that reflects hesitation, not confidence.
Thursday’s drop was broad and aggressive.
Big Tech led the damage, with all seven megacap leaders closing lower and Apple sliding roughly 5% in its steepest one-day fall in months.
AI disruption fears spilled beyond tech into real estate, transport, and software, widening the risk-off tone.
Attention now shifts squarely to consumer inflation data, which could quickly reshape rate-cut expectations.
Premarket movers stand out: Applied Materials is up double digits on strong results and outlook, while Rivian jumps on a revenue beat, with vaccine and biotech names still under pressure.

📉 Futures Dip as AI Rout Lingers Ahead of Inflation Data
U.S. stock futures slipped with Nasdaq -0.08%, S&P 500 -0.06%, and Dow -0.08% as investors stayed cautious following an AI-driven selloff and awaited January CPI data.
🥇 Gold Rebounds 1.5% After 3.2% Plunge Amid Market Turbulence
Gold climbed as much as 1.5% after suffering a 3.2% one-day drop, as dip-buyers stepped in ahead of U.S. inflation data following broader AI-linked market jitters.
🤖 Zhipu Soars 120% in a Week as China’s AI Trade Heats Up
Chinese AI firm Zhipu surged 120% this week, hitting a record HK$492 after a 22% jump Friday, highlighting investor appetite for emerging AI players.
🍏 Apple Falls 5% in Worst Day in 10 Months on AI Delays
Apple shares slid 5%, marking their steepest drop since April, after reports of delayed Siri AI upgrades and fresh regulatory scrutiny.
₿ Bitcoin Slips 3% as $69K Looms as Key Resistance
Bitcoin fell about 3%, with analysts warning bulls lack the momentum to decisively reclaim the critical $69,000 level, a historically significant price zone.
🌏 Asia Markets Extend Losses as AI Fears Weigh on Sentiment
Asia-Pacific stocks tracked Wall Street lower as the S&P 500 logged a third straight loss, with concerns mounting that AI disruption could pressure corporate profits.
🛢️ Oil Set for Weekly Decline as Iran Risks Fade
Brent crude edged up 0.04% to $67.55, while WTI rose to $62.85, but both benchmarks remained on track for a second weekly drop amid easing Iran tensions and oversupply concerns.

Pick a Timeframe. Commit to It.
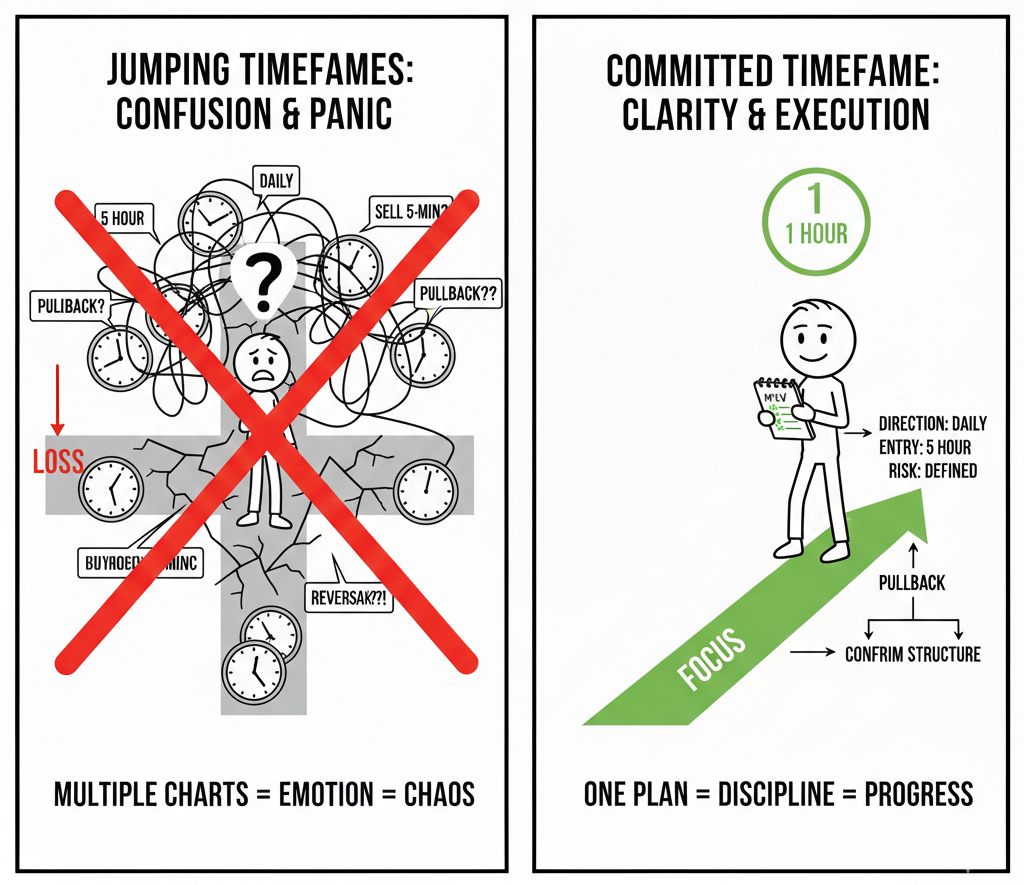
Using more timeframes does not make you smarter. Jumping between them just makes you confused. Many traders look at the daily chart for direction, enter on the 1-hour, then panic on the 5-minute.
That’s where the problem starts. A normal pullback suddenly feels scary. A small move looks like a big reversal. You start reacting instead of following a plan. Your focus shifts from structure to emotion.
Strong traders keep it simple. They decide which timeframe they trade. They know where they look for trend, where they enter, and how they manage the trade. Then they stick to it.
When you commit to one main timeframe, things get clearer. You stop overreacting. You stop second-guessing every candle. Your decisions feel calmer because they follow rules, not noise.
Consistency builds confidence.
If you want trading guidance that keeps things clear and structured instead of overwhelming you with mixed signals, these newsletters help. They focus on discipline, simple frameworks, and steady improvement.

Inverted Hammer
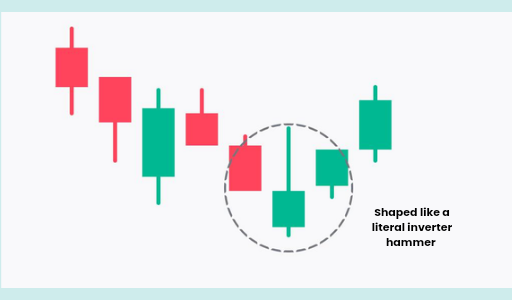
The Inverted Hammer is a bullish reversal pattern that appears at the bottom of a downtrend. It looks like a Shooting Star, but its context is the opposite.
It consists of a small body at the lower end of the candle with a long upper wick. This pattern tells a story of "testing the ceiling"—it shows that buyers finally stepped in to push the price up significantly, and even though they couldn't hold the high, the bears were no longer strong enough to keep the price at the lows.
🛠️ The Strategy Logic
Use these logical triggers to identify when a trend is shifting from bearish to bullish:
- IF: The upper wick is at least two times the length of the candle body and forms after a decline...
- THEN: The signal is valid. The long upper wick represents a "liquidity grab" and proof that bulls are starting to challenge the dominant downtrend.
- THEN: The signal is valid. The long upper wick represents a "liquidity grab" and proof that bulls are starting to challenge the dominant downtrend.
- IF: The Inverted Hammer is followed by a green candle that closes above its body...
- THEN: The reversal is confirmed. This is the most critical step; the Inverted Hammer is a "warning," but the following candle is the "trigger" that proves the bulls have taken control.
- THEN: The reversal is confirmed. This is the most critical step; the Inverted Hammer is a "warning," but the following candle is the "trigger" that proves the bulls have taken control.
- IF: The pattern forms at a major support level or the Lower Keltner Channel...
- THEN: You have a "Spring" setup. The market has dipped into a value zone, and the Inverted Hammer shows the first sign of life from the buyers at that specific price floor.
- THEN: You have a "Spring" setup. The market has dipped into a value zone, and the Inverted Hammer shows the first sign of life from the buyers at that specific price floor.
- IF: The volume on the Inverted Hammer candle is higher than the previous red candles...
- THEN: The signal is high-conviction. It indicates that a large number of shares or contracts changed hands at the bottom, suggesting a "transfer of ownership" from panicked sellers to steady buyers.
- THEN: The signal is high-conviction. It indicates that a large number of shares or contracts changed hands at the bottom, suggesting a "transfer of ownership" from panicked sellers to steady buyers.
- IF: The body of the Inverted Hammer is green...
- THEN: The signal is slightly more bullish than a red one. While the wick is the most important part, a green body means the bulls actually managed to close the price higher than the open despite the intraday volatility.
💡 Pro Tip
The "Bulls are Testing" Secret: Think of the Inverted Hammer as a "reconnaissance mission." The long upper wick is the bulls testing the strength of the sellers higher up. They might have retreated by the end of the day, but they’ve proven the path upward is open.
If you see an Inverted Hammer followed immediately by a regular Hammer, you have a "Double Bottom" on a microscopic scale, which is one of the most powerful bullish setups in candlestick trading.

The “One More Trade” Lie
You tell yourself you’re done. Clean session. Solid discipline. Decent P&L.
Then price twitches… and suddenly your mouse has “one more trade” energy.
Let’s call it what it is — A TRAP WE DRESS UP AS OPPORTUNITY.
The market always looks most attractive right after you decide to stop.
That’s not edge.
That’s exhaustion wearing a clever disguise. I’ve seen traders protect rules for six straight hours — then donate the day’s profit in the final 20 minutes because they wanted a “bonus win.”
Late trades are rarely planned. They are emotionally negotiated.
FATIGUE DOESN’T FEEL LIKE TIREDNESS — it feels like urgency.
IMPULSE PRETENDS TO BE CONVICTION.
Make your rule mechanical:
MAX TRADES PER DAY = HARD STOP.
Platform closed. No chart “just checking.” No hero entries.
Treat your trading day like market hours. There is an opening bell — and there must be a closing bell.
Discipline is not proven at the first trade.


