Adobe Sinks as CEO Exits
....................................................................................................................


Good morning.
If you thought yesterday’s 700-point Dow drop was just a bad dream, the futures market is here to wake you up.
We’re staring at a sea of red this Friday as the major benchmarks hit their lowest levels since November. The Nasdaq is leading the slide, down 0.5%, as investors start to realize this isn't just a "dip"—it’s a total shift in the weather.
The "War Fog" has officially turned into a storm. Israel launched fresh strikes on Tehran, and with sirens wailing in Turkey, the conflict is widening by the hour.
Oil is basically the only thing "winning" right now; Brent just crossed the $100 mark for the first time since 2022.
Even with the US waiving Russian sanctions to try and douse the flames, Iran’s grip on the Strait of Hormuz has created what looks like the largest supply disruption in history.
It’s a "risk-off" finish to a brutal week.
Stay defensive and keep your eyes on the headlines—things are moving fast.

🛢️ Oil Heads for Weekly Surge Despite Russia Waiver
Brent crude climbed to about $101.48, heading for a ~10% weekly gain, while WTI traded near $96.67 even after the United States issued a 30-day waiver allowing purchases of stranded Russia oil.
📊 U.S. Futures Rise as War Risks Loom
Futures ticked higher with Dow up 0.5%, S&P 500 0.4%, and Nasdaq 0.3% as investors watched rising oil prices and potential economic fallout from Middle East tensions.
📉 Tech Giants Near Correction Territory
The “Magnificent Seven,” including Nvidia, Apple and Tesla, are nearing a 10% correction as war-driven oil spikes pressure growth stocks.
⛔ Adobe Stock Drops 8% as CEO Steps Down After 18 Years
Shares of Adobe fell more than 8% in premarket trading after CEO Shantanu Narayen announced he will step down after 18 years in the role, even as the company reported solid quarterly results.
💥 Markets Brace for Prolonged Iran War
Oil surged and global markets slid as tensions between the United States and Iran deepened, with Tehran warning crude could soar to $200 per barrel.
🪙 Bitcoin Reclaims $71K as Altcoins Outperform
Bitcoin crossed $71,000 again this month, while Solana and Dogecoin led gains ahead of key U.S. inflation data.
🌏 Asian Stocks Slide as Oil Near $100 Fuels Inflation Fears
Regional markets dropped for a second week as the Iran conflict kept crude near $100, boosting the US Dollar and weakening expectations for rate cuts.

The Market Changes. Your Strategy Should Notice.
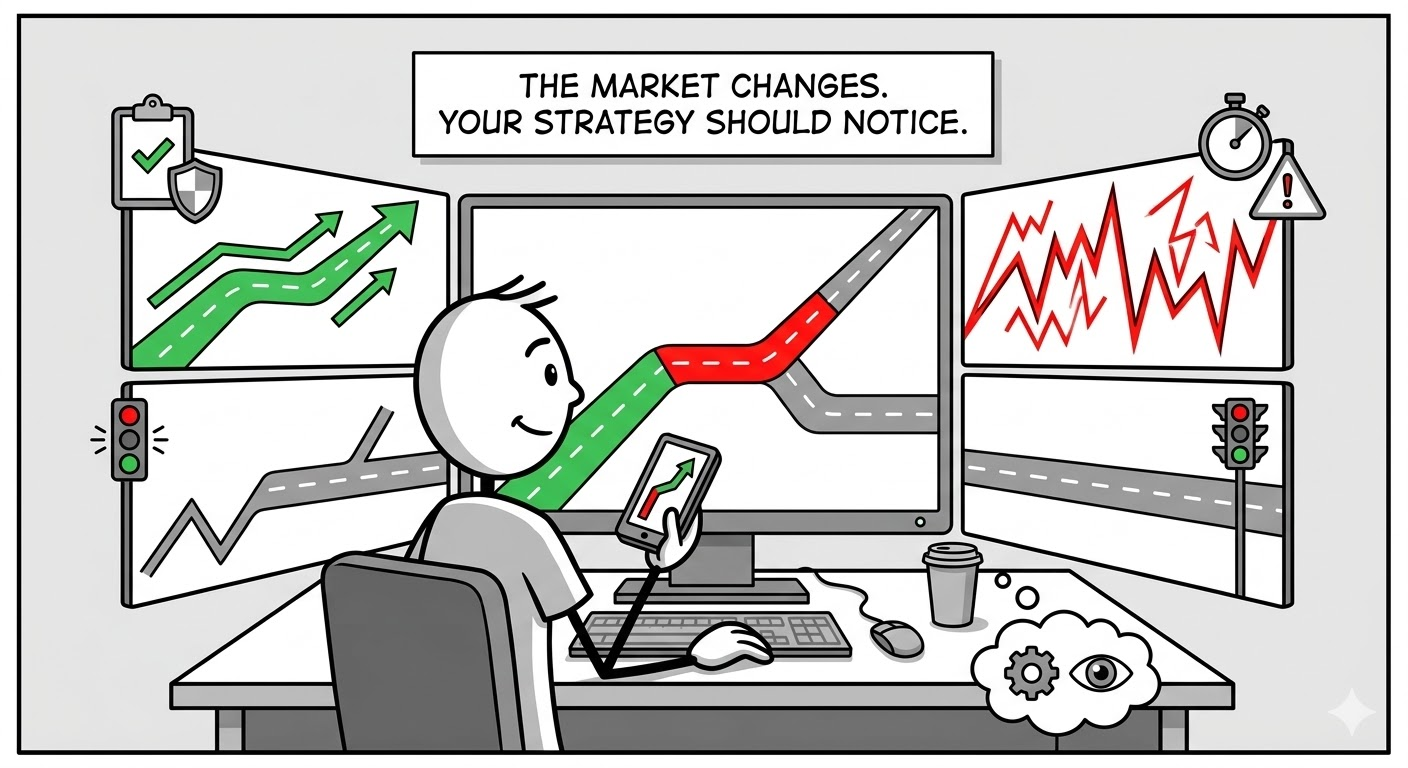
Many traders apply the same strategy every day. The same entries. The same expectations. The same position sizes.
But markets are never static.
Some days trend strongly. Other days move sideways. News events can suddenly increase volatility, while quiet sessions can make price barely move. When traders ignore these conditions, the same strategy can produce very different results.
This is where frustration begins. A setup that worked well last week suddenly struggles. Instead of asking what changed in the market, traders assume the strategy stopped working.
Strong traders read the environment first. They notice when momentum is strong, when volatility is high, and when markets are quiet. Then they adjust expectations or simply wait for conditions that fit their approach.
When you pay attention to market conditions, your decisions become more realistic and your trades more consistent.
Good traders don’t just trade. They keep learning how markets behave and how other disciplined traders think. If you enjoy thoughtful market insights and structured trading ideas, these newsletters are worth exploring.

Chande Momentum Oscillator (CMO)
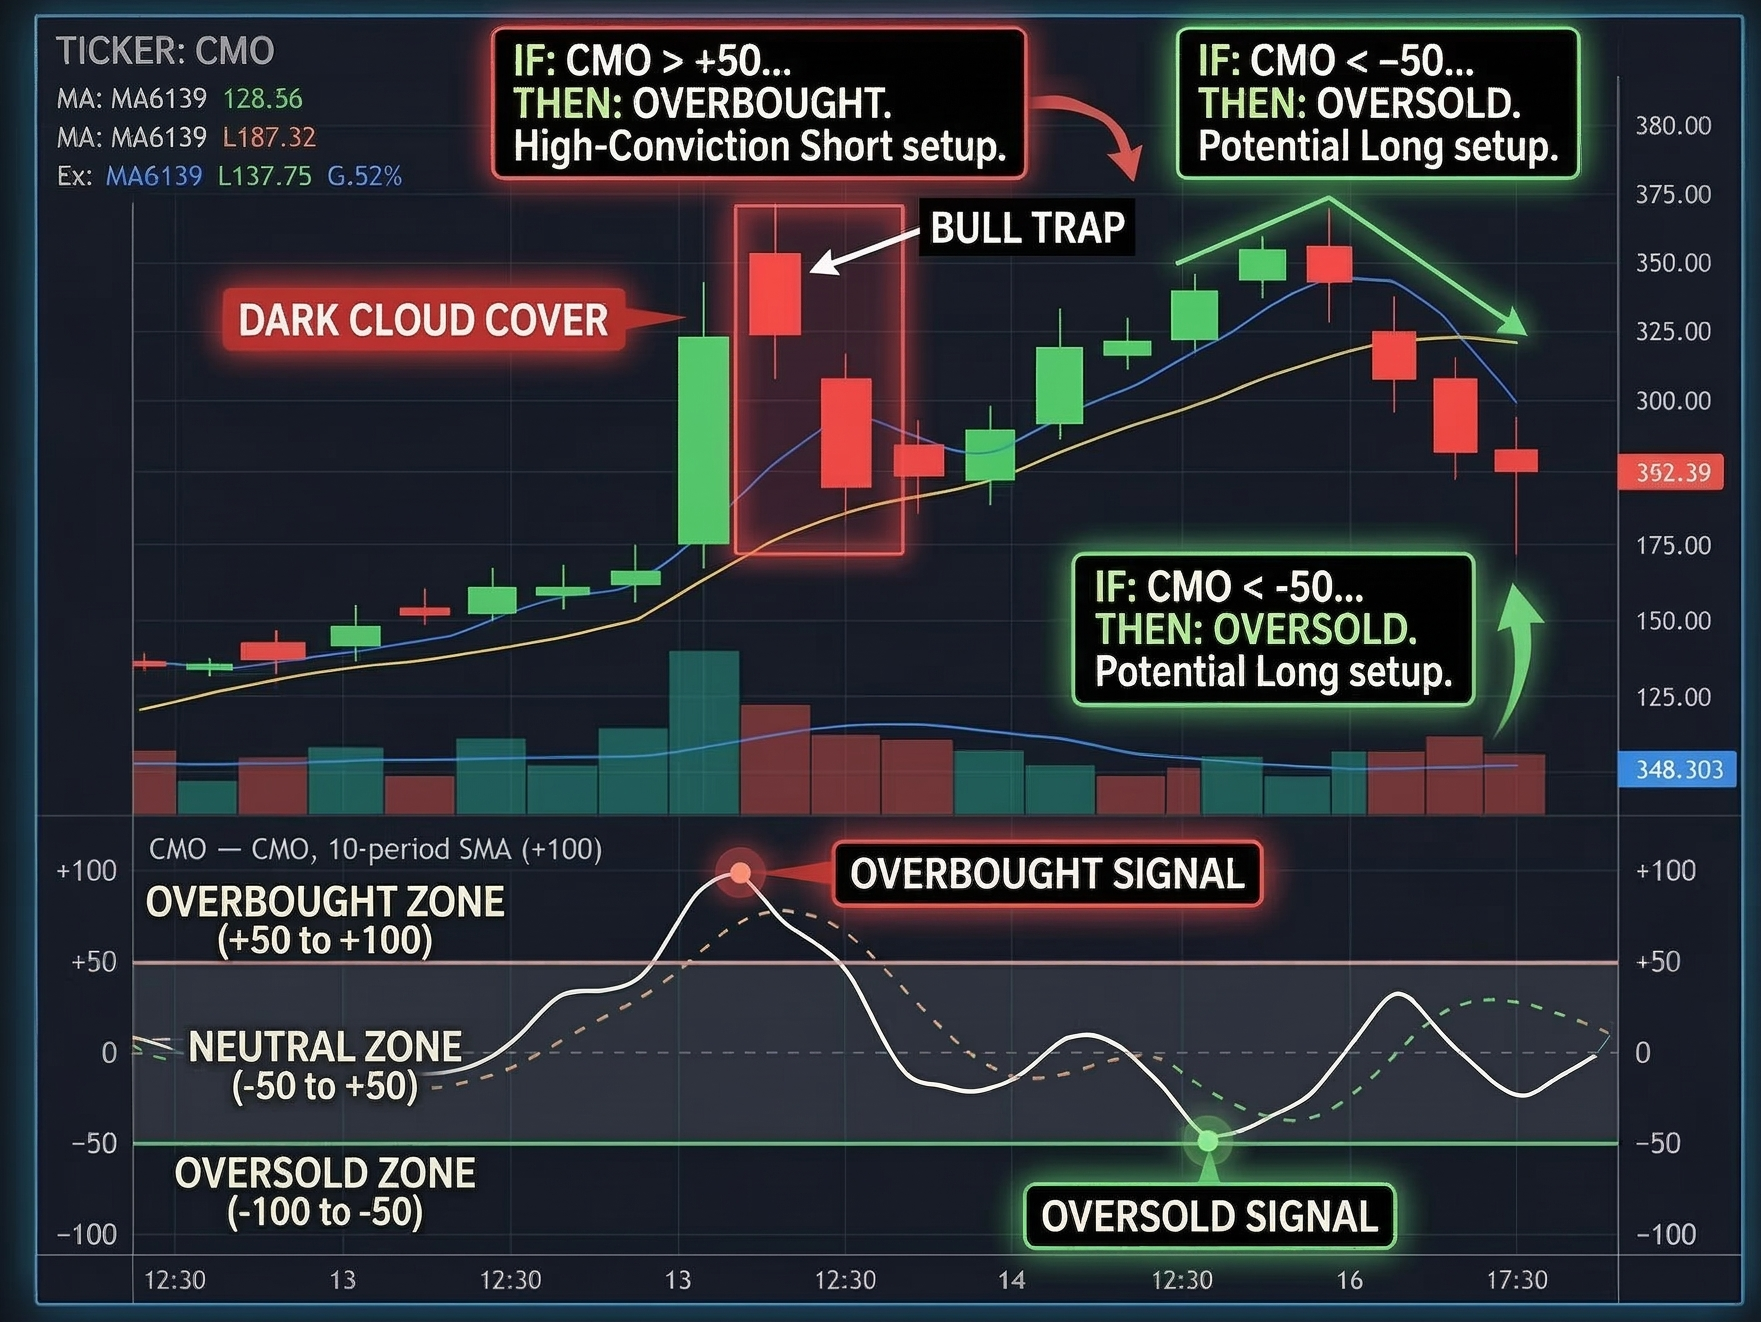
Created by Tushar Chande, the CMO is a momentum oscillator similar to the RSI but with a key difference: it uses data from both up days and down days in the numerator, making it more sensitive to price fluctuations.
It measures the "internal strength" of a trend on a scale from -100 to +100, with 0 being the absolute neutral point.
🛠️ The Strategy Logic
Use these logical triggers to identify overextended markets and high-velocity trend shifts:
- IF: The CMO line crosses above the +50 level...
- THEN: The market is in a "Strong Bullish" state but is entering the Overbought zone. While the trend is powerful, be cautious about entering new long positions here; instead, look for signs of exhaustion.
- THEN: The market is in a "Strong Bullish" state but is entering the Overbought zone. While the trend is powerful, be cautious about entering new long positions here; instead, look for signs of exhaustion.
- IF: The CMO line crosses below the -50 level...
- THEN: The market is in a "Strong Bearish" state and is Oversold. This suggests a high probability of a "relief bounce" or a V-shaped recovery as sellers become exhausted.
- THEN: The market is in a "Strong Bearish" state and is Oversold. This suggests a high probability of a "relief bounce" or a V-shaped recovery as sellers become exhausted.
- IF: Price makes a new high, but the CMO makes a lower high (Bearish Divergence)...
- THEN: The uptrend is "losing its pulse." Despite the higher price, the actual momentum is weakening. This is a primary signal that the trend is about to reverse or enter a deep consolidation.
- THEN: The uptrend is "losing its pulse." Despite the higher price, the actual momentum is weakening. This is a primary signal that the trend is about to reverse or enter a deep consolidation.
- IF: The CMO crosses above its own 9-period moving average (Signal Line)...
- THEN: Short-term momentum has shifted to the upside. This is often used as a "trigger" to enter a trade early before the zero line is even crossed.
- THEN: Short-term momentum has shifted to the upside. This is often used as a "trigger" to enter a trade early before the zero line is even crossed.
- IF: The CMO crosses the 0 (Zero) line...
- THEN: The dominant trend has officially flipped. A cross above 0 means bulls have taken the majority of the momentum; a cross below 0 means bears are now in the driving seat.
💡 Pro Tip
The "Trend Strength" Filter: Because the CMO is very sensitive, it can stay in Overbought (+50) or Oversold (-50) territory for a long time during a strong trend. To avoid "picking a top" too early, pair the CMO with the Aroon Indicator. If the CMO is above +50 but the Aroon Up is at 100, do not sell.
Only exit or short when the CMO drops back below +50 AND the Aroon Up line begins to fall. This ensures you don't jump out of a "Super Trend" too early.

The Quiet Market Anxiety

Imagine a trader staring at the chart on a slow afternoon.
“Nothing is moving today.” “No setups. Market is dead.”
For hours the EUR/USD sits in a tight range. Small candles. No momentum. No clear direction.
Instead of stepping away, the trader stays glued to the screen.
Zooms into the 1-minute chart.
Starts drawing smaller levels.
Convincing himself there must be something to trade.
Eventually a tiny breakout appears.
He takes it.
It fails.
Now frustration enters the picture.
He flips short. That fails too. Then another trade. Then another.
By the end of the session he has taken five or six trades in a market that barely moved.
The strategy wasn’t the problem.
THE SILENCE WAS.
Most traders think high volatility is dangerous.
But a lot of accounts slowly bleed during quiet markets because inactivity starts to feel uncomfortable.
Your brain hates waiting.
No movement feels like missed opportunity. Flat charts feel like wasted time.
So the mind invents reasons to trade.
A weak breakout suddenly looks convincing. A random candle suddenly feels meaningful. A small move suddenly looks like a trend.
BOREDOM BECOMES THE SIGNAL.
But quiet markets often exist for a reason.
They are liquidity-building phases, where price compresses before the real move appears later.
Professional traders recognize this quickly.
When volatility shrinks, they don’t force activity.
They reduce activity.
Sometimes the most professional move is simple:
Close the charts. Step away. Wait for expansion.
Because trading is one of the few professions where doing nothing can be the correct decision.
You are not paid for screen time. You are not paid for effort.
You are paid for selectivity.
And when the market is quiet, the real edge isn’t finding a trade.
It’s having the discipline not to manufacture one.