
A Deal at Last!
....................................................................................................................


Happy Monday Traders!
Markets kicked off the week with a burst of optimism, and this time, it’s politics fueling the rally. US stock futures climbed Monday morning as investors cheered signs that Washington might finally be wrapping up its record-breaking government shutdown.
Tech stocks once again took the lead in the rebound. Nasdaq 100 futures popped 1.4%, while the S&P 500 gained 0.8%. The Dow Jones, with fewer tech names in its mix, followed modestly higher by 0.3%.
The sudden shift in sentiment came after weekend negotiations in Washington pushed a new spending bill closer to the finish line. Late Sunday, lawmakers introduced a proposal that cleared an early Senate vote, signaling that the 39-day shutdown - the longest in US history - could soon be history itself.
It’s a welcome break after last week’s rough patch, which saw tech stocks take a beating. Nvidia and other AI heavyweights stumbled under pressure from fears of stretched valuations and an “AI bubble” losing air. But with political gridlock easing, traders are breathing a little easier.
Next up: earnings season continues to command the spotlight. This week brings updates from CoreWeave, Oklo, and Rocket Lab - all names that could stir the tech sector again. Meanwhile, Disney and Paramount Skydance will give investors a read on how the entertainment industry is holding up amid changing audience habits.
And while equities gain ground, gold isn’t sitting out the action - it’s chalking up a second straight day of gains after last week’s steep pullback from record highs.

📈 Markets Jump on Shutdown Deal Hopes
Futures tied to the S&P 500 climbed ~0.7% and those for the Nasdaq 100 rose ~1.2% on signals that the U.S. government shutdown might be ending and an analyst sees tech stocks still headed for an 8-10% rally by year-end.
⛔ Don’t Panic Amid Tech Pullback—Yet
Despite recent drops in the mega-cap tech names, CNBC reminds traders not to hit the panic button just yet: the sector pull-back may be a healthy reset rather than a collapse, especially with earnings season still delivering surprises.
💰 Meta Platforms Commits $600B to AI Build-out
Meta unveiled a plan to invest US$600 billion in the U.S. over the next several years primarily to build out AI data-centres and infrastructure signalling that the AI arms-race is going super-sized.
🌏 Asian Markets Edge Higher as Shutdown Winds Down
Global equities climbed as investors seized on progress toward ending the U.S. government shutdown — Asian stocks rallied even as data gaps persist and tech valuations remain under scrutiny.
🚧 Bitcoin Faces Critical $102K Threshold
Bitcoin is teetering near the US $102 000 mark as the possibility of a fourth “death-cross” looms for this bull cycle - a technical red flag that could shake even the most confident crypto bulls.
🚨 Retail Traders Double Down: AI & Crypto Ignore Bubble Warnings
Individual investors are shrugging off alarm bells about inflated asset prices and instead are piling into artificial-intelligence infrastructure and crypto — suggesting they see this rally not as a bubble but as a breakout.
🧈 Gold Hits Two-Week High on Rate-Cut Hopes
Spot gold surged about 1.8% to around US $4,070.99/oz, as traders bet on a December rate cut by the Federal Reserve and fretted over signs of a global slowdown.

Trading Shouldn’t Feel Like Solving a Puzzle Every Morning.

If every trading session feels like you’re piecing together a mystery, something’s off.
The market shouldn’t feel like a riddle you must solve before 9:30 a.m.
It should feel like a process you understand.
When you trade without structure, every candle becomes a question mark.
You overanalyze, hesitate, and end up reacting instead of executing.
A solid plan turns all that noise into clarity. You know what to look for, what to ignore, and when to act.
Trading gets easier when you stop guessing and start following a repeatable system.
Let your rules do the thinking - your job is to follow them.
If you want trading to feel simple, not stressful, these newsletters will help. They break down clear, rule-based methods that remove confusion and bring confidence back to your mornings.

Ascending Triangle
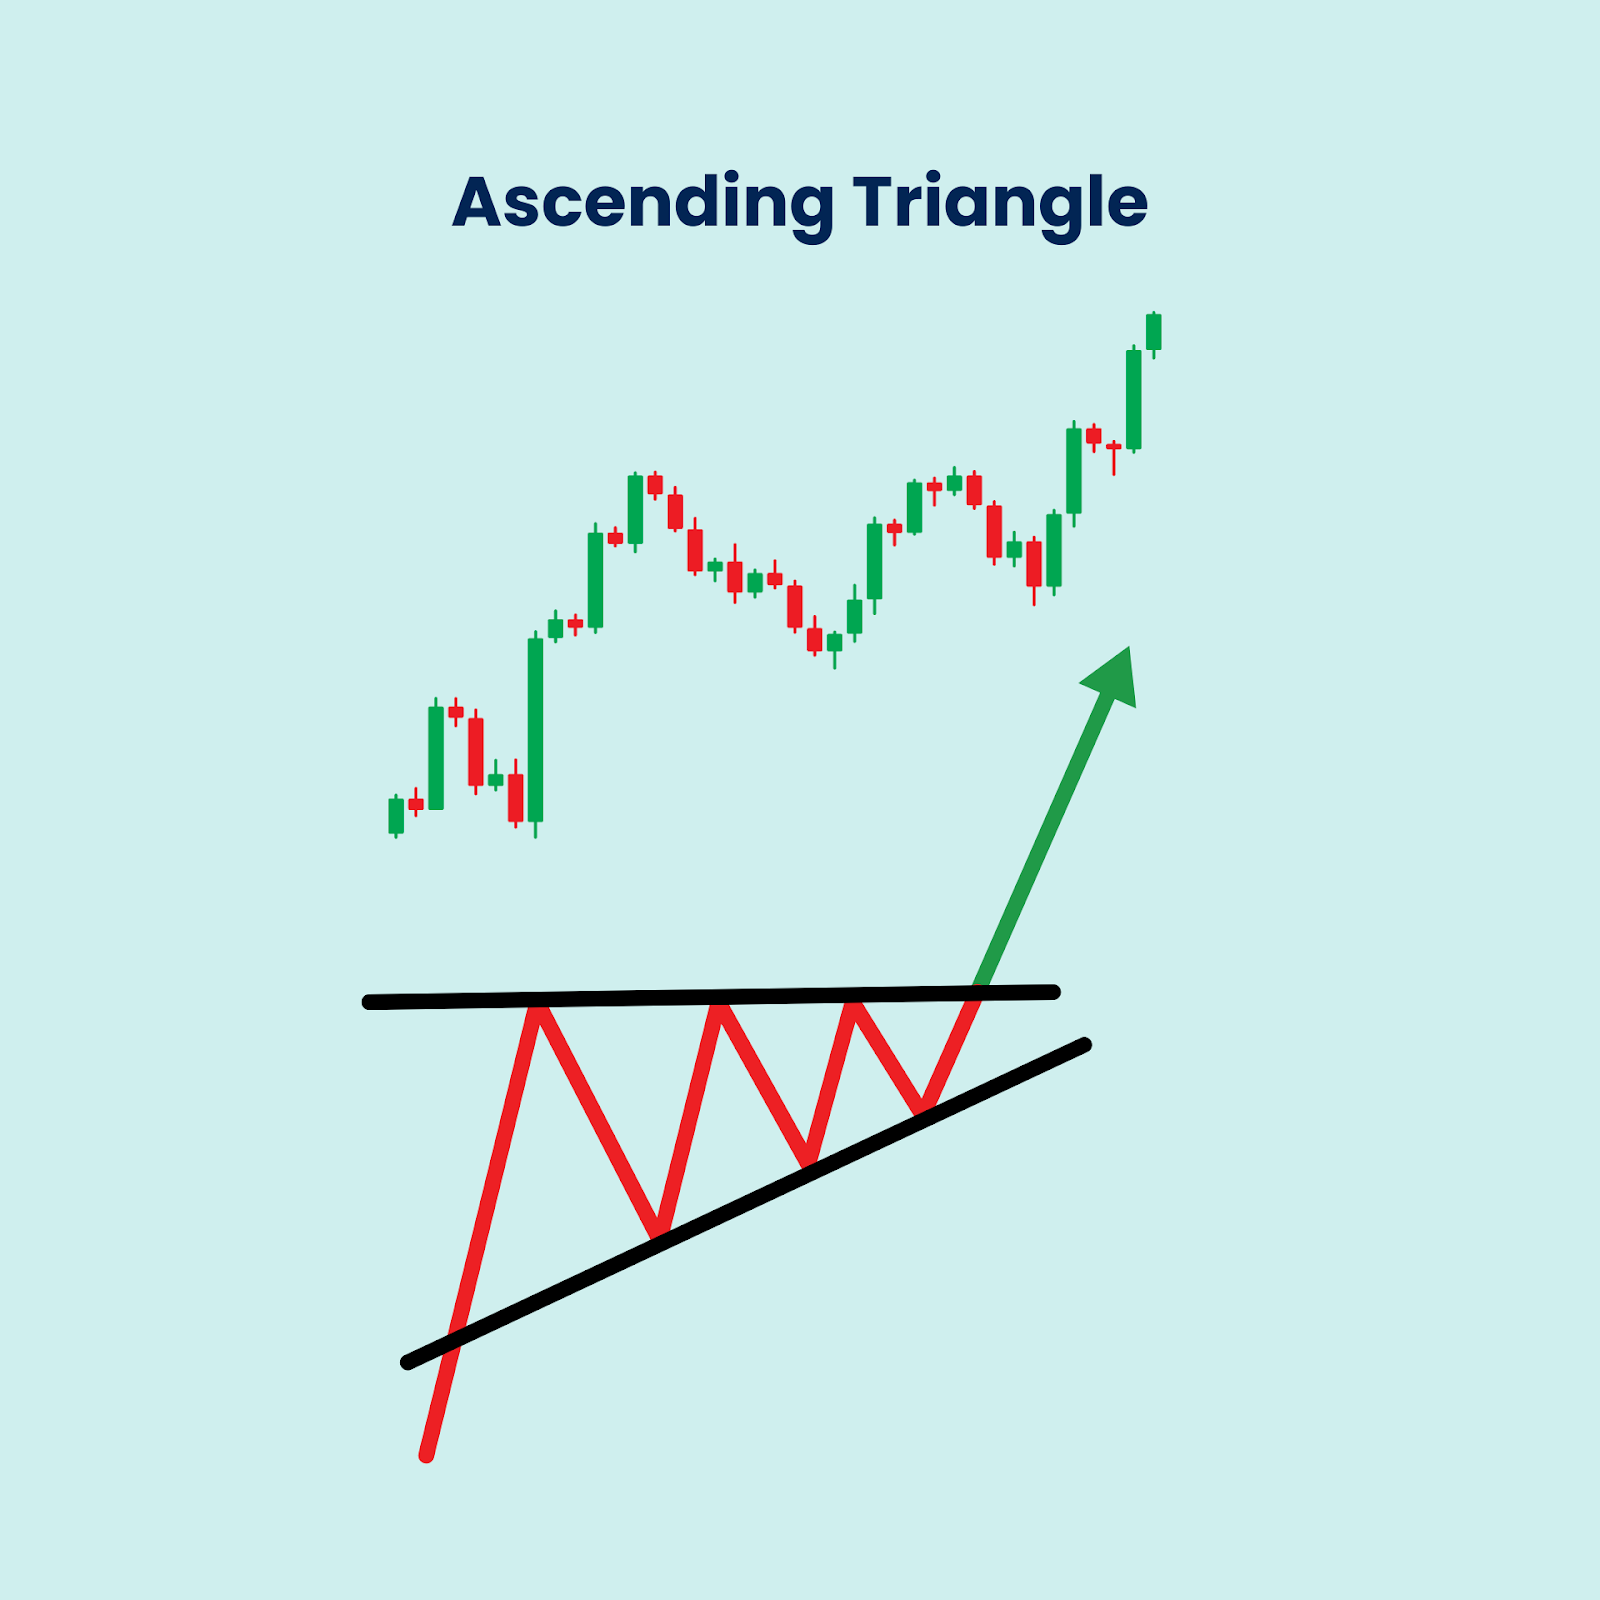
The Ascending Triangle is a strongly bullish continuation pattern that forms during an uptrend.
It signals that buyers (demand) are more aggressive than sellers (supply) and that the price is likely to break out to the upside and continue the prior trend.
The pattern is defined by two converging lines: a flat or horizontal upper trend line (resistance) and a rising lower trend line (support).
The horizontal resistance level shows consistent selling at the same price, but the rising support shows that buyers are willing to step in at increasingly higher lows, building pressure for a breakout.
What to Look For (Key Features and Signals)
- Pattern Shape: The pattern is formed by a flat upper line connecting two or more highs at roughly the same price level, and an upward-sloping lower line connecting two or more rising lows.
- Implied Direction: It carries a strong bullish bias. The rising support line confirms that demand is persistently overcoming supply, which compresses the price against the firm resistance level.
- Volume Trend: Trading volume should generally decrease as the price consolidates within the triangle, reflecting a period of quiet accumulation. This is healthy consolidation.
- Breakout Confirmation: The pattern is confirmed when the price breaks decisively above the flat, horizontal resistance line. This breakout should be accompanied by a noticeable spike in volume to validate the strong shift from consolidation back to the active trend.
- False Breakout Check: Be wary of the price briefly poking above the resistance line only to fall back (a false breakout or "fake-out"). Traders often wait for a candle to close clearly outside the triangle to confirm the breakout's validity.
- Target Price: The traditional price target is calculated by measuring the height of the triangle at its widest part (the base) and projecting that distance upward from the breakout point.

Trader Burnout Isn’t From Trading Too Much
Most traders think burnout comes from spending too many hours at the charts.
It doesn’t. It comes from never turning your brain off.
From checking your PnL while eating, scrolling through price updates before bed, and replaying every missed entry in your head.
You’re not exhausted from clicking buttons.
You’re exhausted from never stepping away.
Your mind never resets, so every chart starts to look like noise.
You lose patience, clarity, and eventually, confidence.
Trading is a mental game. It needs sharpness, not constant stimulation.
When you rest, your mind starts to connect dots again.
You begin to see setups clearly instead of forcing them.
You start trading with intent instead of reacting out of fatigue.
You don’t need more screen time. You need more quiet time.
The market rewards clarity and clarity only shows up when your mind is still.


