
$3,500 Gold Flex
....................................................................................................................


Markets kicked off with a bang - judge ruled Google won’t be broken up. Chrome stays intact, Android too, but Google has to ease up on search deals.
Stock popped 7% and futures rode the wave higher.
At the same time, gold ripped past $3,500 as traders keep betting on Fed cuts.
In EV land, Nio crushed August deliveries - stock up 36% while Tesla keeps bleeding in Europe.
And over in crypto, BTC traders are split; either we squeeze over $115K or dump to $94K first.
September’s here. The tape’s already moving fast.

📉 Futures Flat, Drama Ahead
Dow, S&P, and Nasdaq barely budged as traders braced for Trump’s tariff fight and September’s ugly stock history.
🟡 Gold Blasts Past $3,500
Bulls cheered as gold smashed fresh highs on Fed cut bets - Schiff says miners could gap-up like rockets.
🚘 Nio Smokes Tesla, BYD
Shares ripped 36% in August as Onvo and Firefly smashed delivery records—Wall Street finally waking up.
💥 Tesla’s Europe Crash
Eight months of losses, 50%+ drops in key markets, and BYD stealing Spain, Portugal, and even Norway.
💵 Dollar Wobbles Post-Holiday
Greenback barely bounced after a brutal five-day slide—traders still eyeing gold as the real safe haven.
🚀 BTC Squeeze or Slide?
Shorts are stacked near $115K, but traders warn a wick toward $94K could wreck long stops first.
🪙 ETH Near $5K, XRP Eyes $3.66
Ethereum’s just 11% from ATH, while XRP and Tron line up for their own moonshot tests.

Acadian Asset Management Inc. (NYSE: AAMI) – 🔄 Trade Update
We’re adding another entry at $50.52.
With this new layer, our BE price shifts to $48.84.
Tightening our position and giving us a stronger edge if momentum finally turns in our favor.
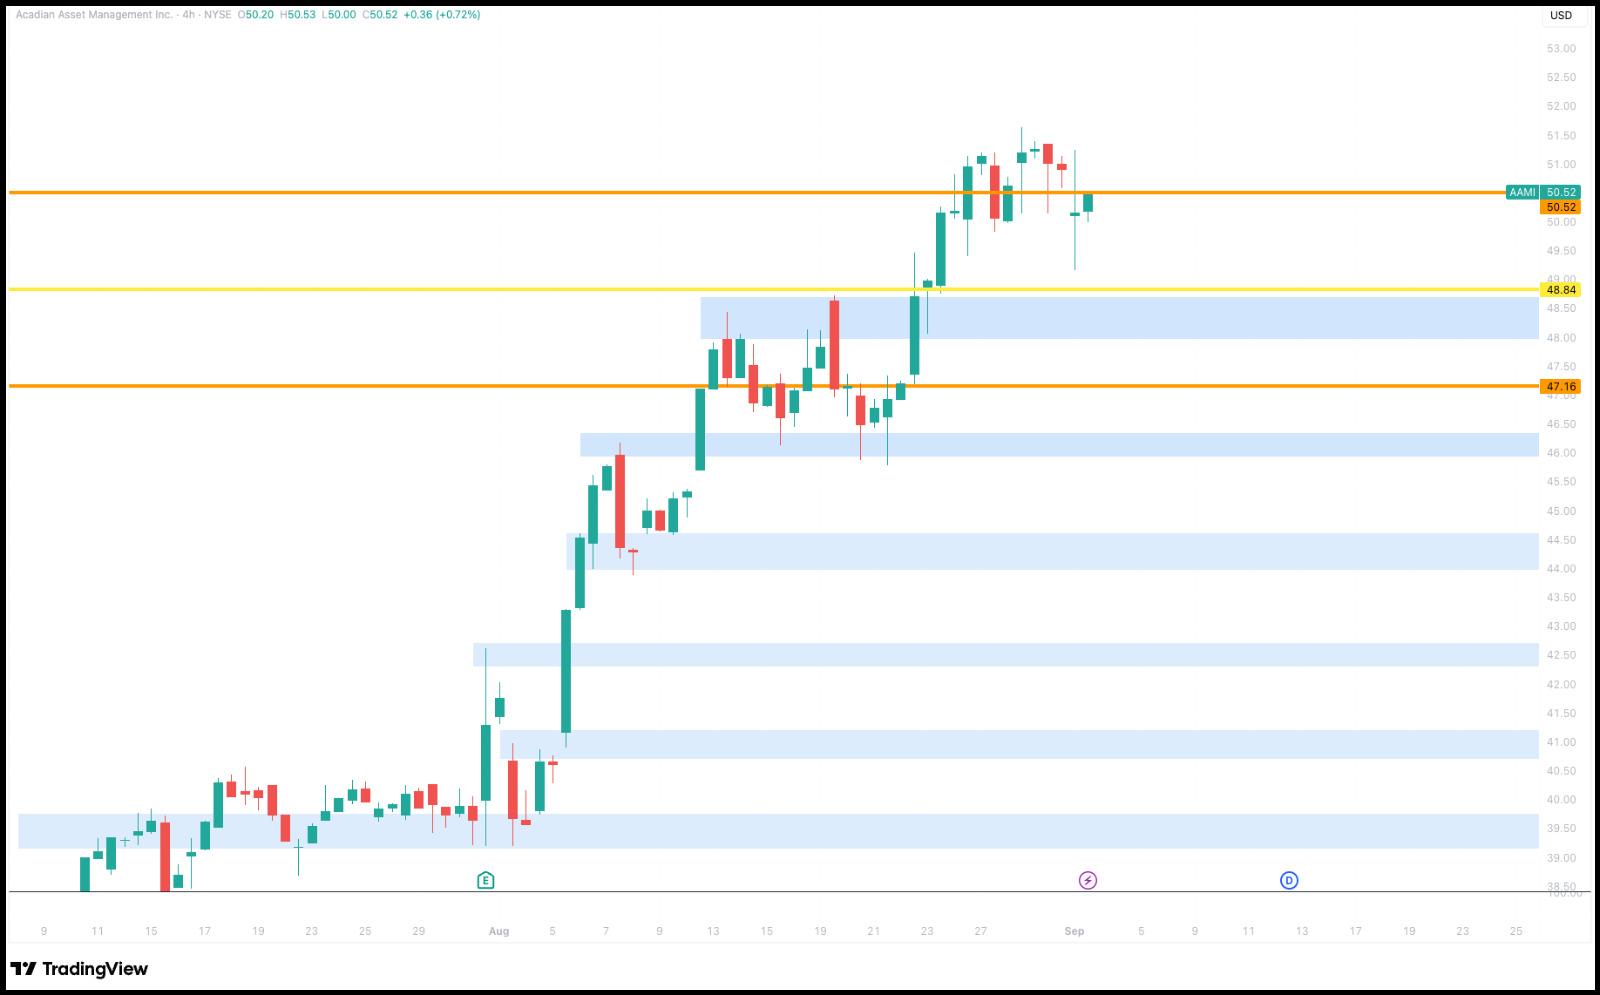
The chart is stretched, signals are lining up, and patience here can pay off big.
We stay positioned and let the market show us the next move.
Recommendation - Zoom Video Communications (NASDAQ: ZM)
Zoom has been riding a shaky wave lately, with price action showing weakness as it taps into our AV SNR zone.
The candles are struggling to hold ground, momentum is thinning, and the chart is flashing all the signs of a breakdown waiting to happen.
That’s where we step in to sell at $81.92.
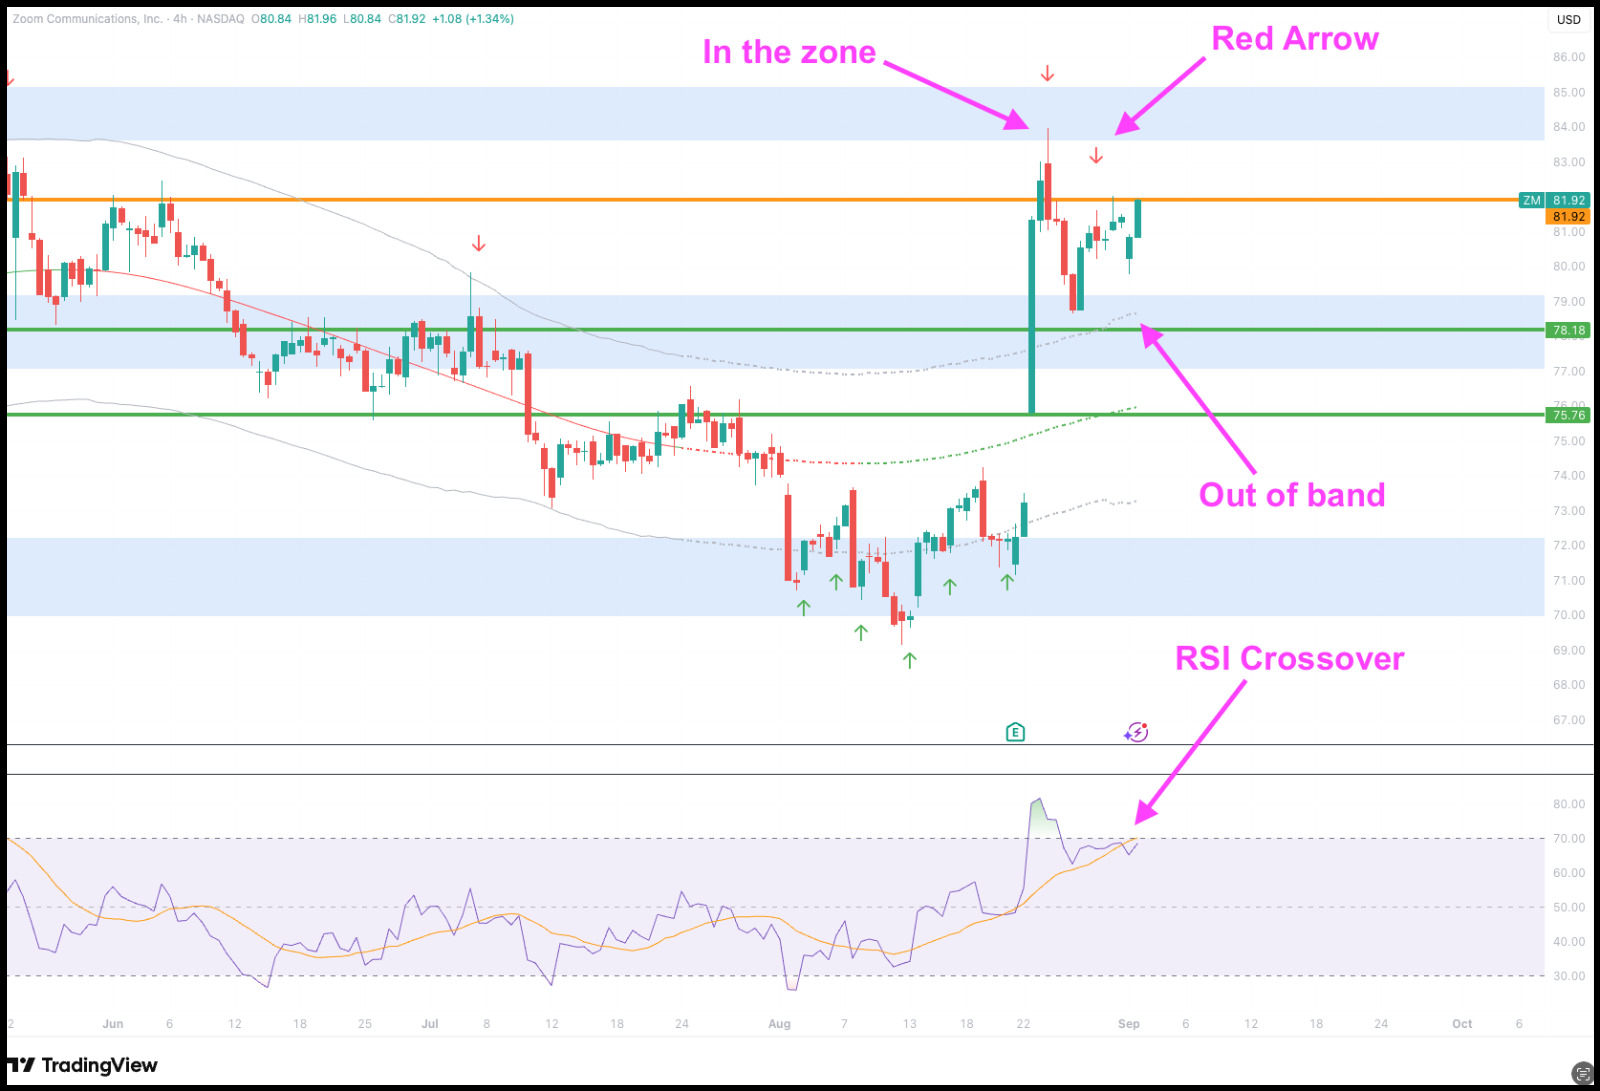
We’re looking to ride the next leg down, letting the market do the heavy lifting while we position ourselves smartly.
🎯 Targets:
Sell: $81.92
TP1: $78.18
TP2: $75.76

If Experts Were the Only Ones Allowed, There’d Be No Traders Left
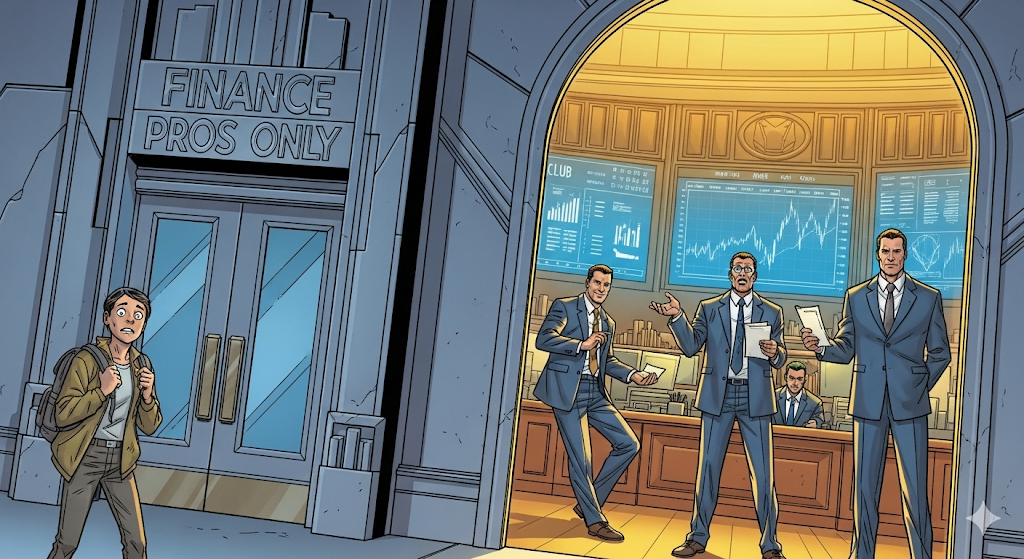
Here’s a secret the industry doesn’t tell you: every “expert” you see today once placed a clumsy, uncertain first trade.
Nobody starts out a master. They learned by showing up, making mistakes, and improving over time.
But too many beginners never even try because they assume trading is some exclusive club reserved for finance pros with fancy degrees and Bloomberg terminals.
That false belief is the biggest barrier of all.
The market doesn’t care about your résumé. It cares about your decisions, your risk management, and your consistency.
And that’s where the right guidance makes all the difference.
These trading newsletters cut through the myths, give you clear insights, and show you how to take action even if you’re just starting out.
🚀 Don’t wait until you “feel like an expert.” Start learning by doing.
👉 Check out these trading newsletters here

Three Inside Down
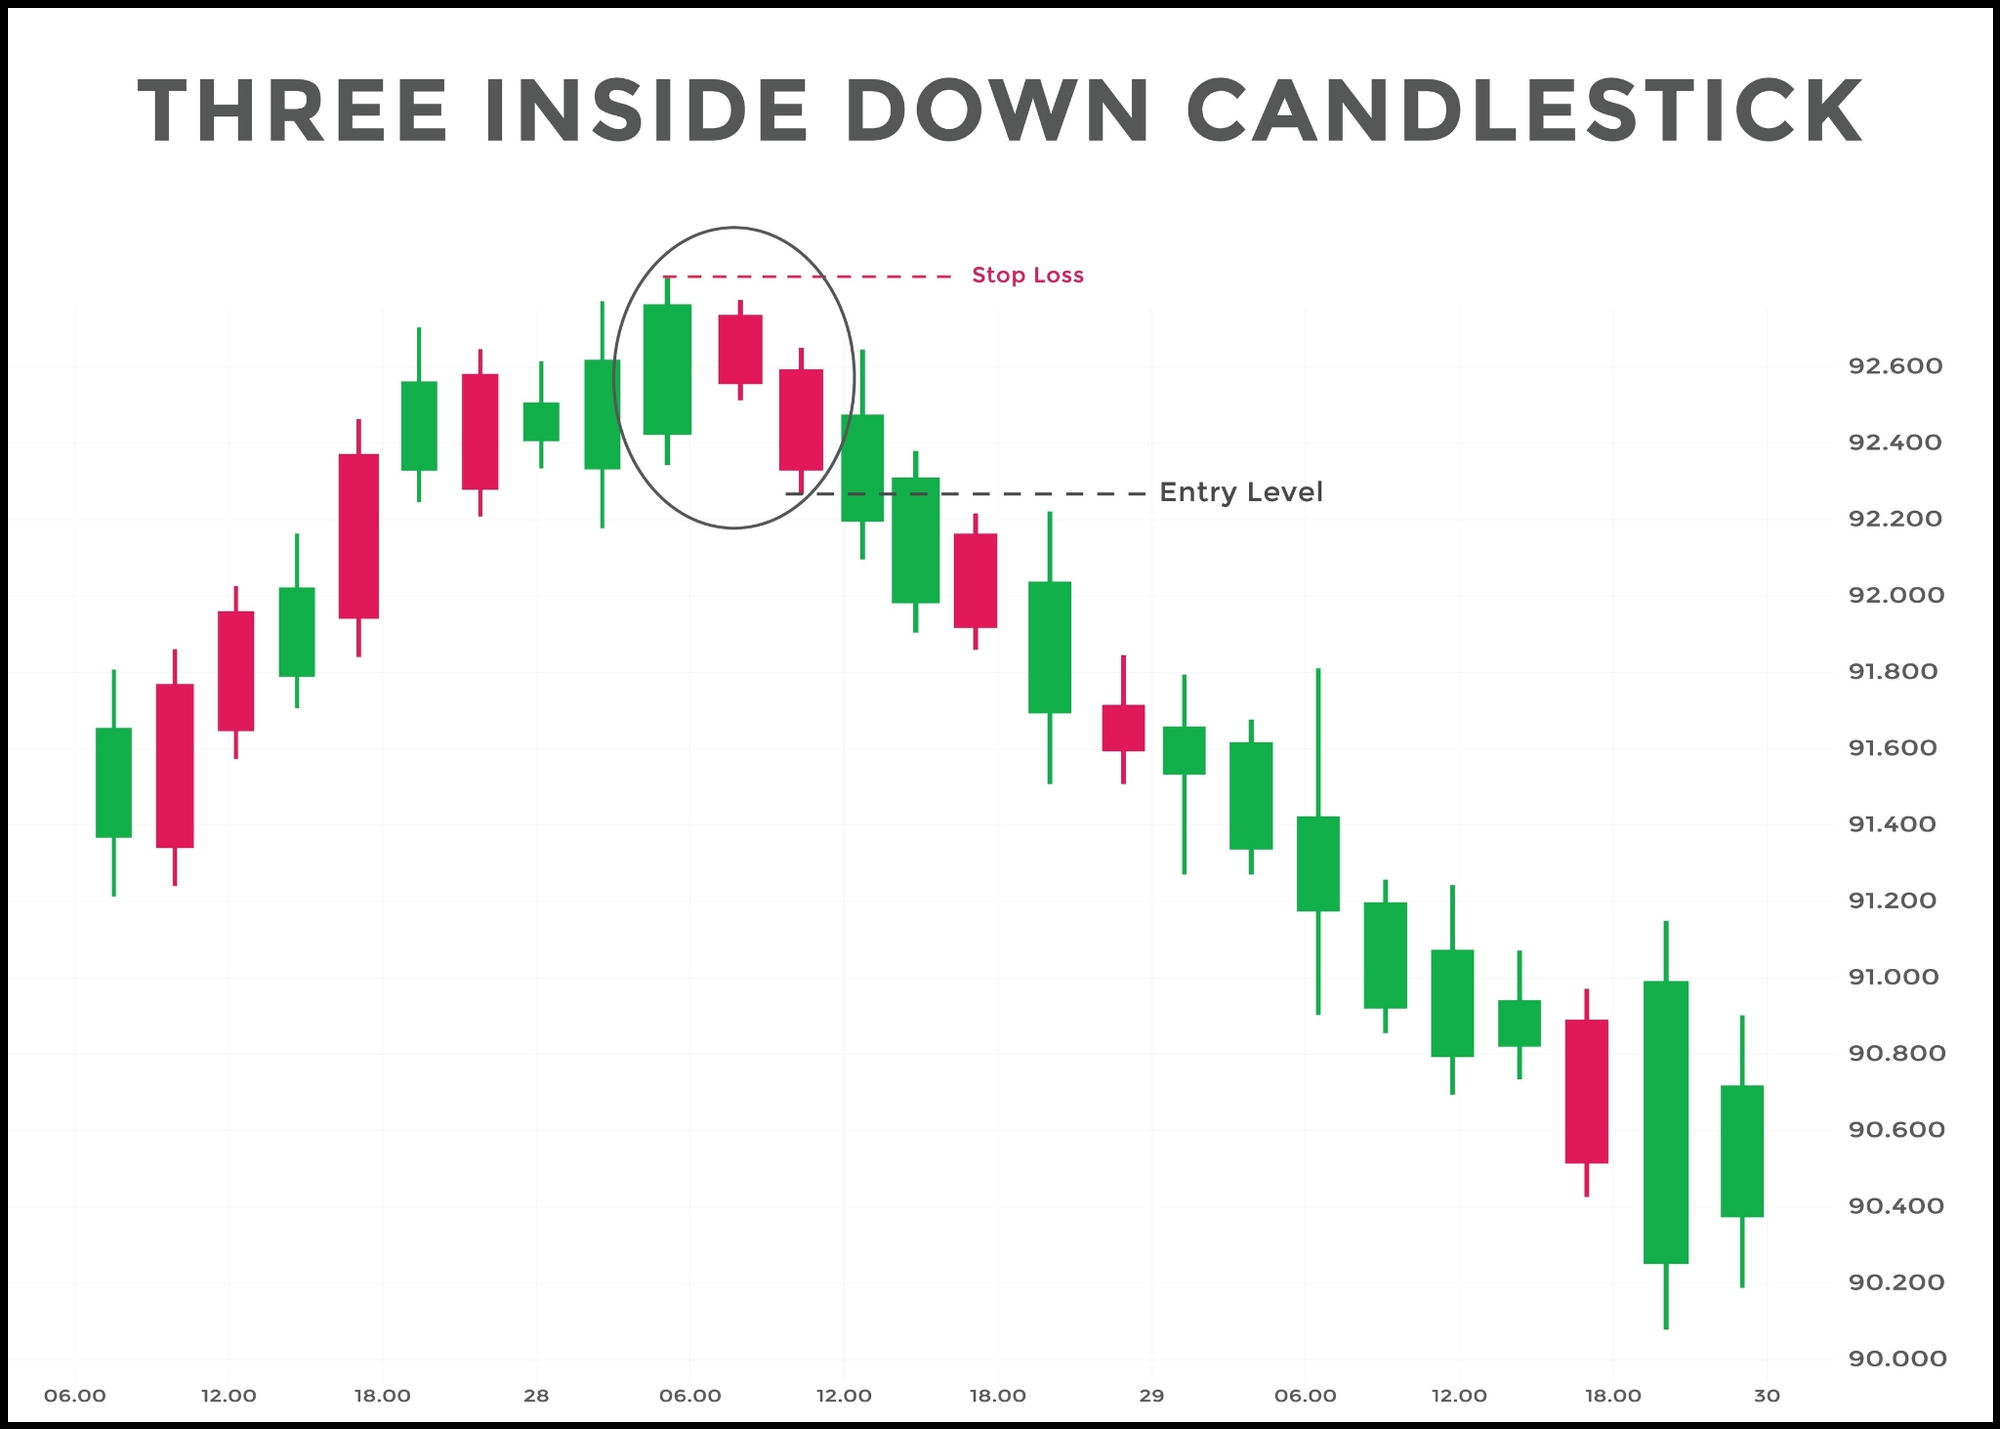
What to Look For
- First Candle (Bullish): A long bullish (green or white) candle, which confirms the existing uptrend.
- Second Candle (Bearish): A smaller bearish (red or black) candle that is completely contained within the body of the first candle. This candle signals a pause or indecision, as the buying pressure has stalled. These first two candles form a Bearish Harami pattern.
- Third Candle (Bearish): A strong bearish (red or black) candle that closes below the low of the second candle. This is the key confirmation candle, as it shows that sellers have decisively taken control and are pushing the price lower.
- Appearance After an Uptrend: For it to be a valid reversal signal, it must appear at the end of a clear uptrend. The longer the preceding uptrend, the more significant the pattern.
- Psychology: The pattern reflects a shift in market sentiment. The first candle shows buyers are in control. The second candle shows sellers are beginning to enter the market and halt the advance. The third candle is a decisive victory for the sellers, signaling a new potential downtrend.
- Volume: An increase in volume on the third candle can add more weight to the reversal signal, indicating that the selling pressure is strong.

The global financial order is quietly reshaping itself.
For the first time in 30 years, the U.S. dollar’s share of global reserves has slipped to historic lows as countries diversify into gold.
This isn’t a passing trend, it’s the natural consequence of too much debt, too much printing, and political choices that weaken confidence in the world’s reserve currency.
Trump’s new spending package will only accelerate the cycle.
More debt.
More inflationary pressure.
More reason for nations and investors to seek stability in hard assets.
So how should you think about it?
The timeless lessons apply:
- Hold less fiat, more assets that preserve value.
- Diversify widely across asset classes and regions.
- Own companies with real pricing power - the ones that can adapt no matter how the tides turn.
One strong month can erase months of drawdowns, just as one well-timed pivot in your portfolio can change the arc of your financial future.

Don’t anchor to the past.
Stay adaptive, because the rules of the game are shifting in front of us.


