2026’s Biggest IPOs Incoming
....................................................................................................................


New year. New tape. Same promise.
First—thank you. If you’re reading this, you trusted us through the chaos of 2025, and you’re kicking off 2026 with us.
We see you. And we don’t take it lightly that this newsletter has become one of your go-to sources for clear, reliable market TLDRs.
No noise. No fluff. Just what matters.
Let’s get to work.
Wall Street wasted no time flipping the calendar. US stock futures climbed early Friday as markets opened the first trading session of 2026, extending a powerful run after a third straight year of double-digit gains.
The S&P 500 and Nasdaq futures led the charge, with tech getting an early bid after fresh momentum out of Asia pushed a regional tech index to record highs.
The backdrop? A market shaking off a choppy finish to 2025 but stepping into the new year with cautious optimism. Stocks enter 2026 after posting sizable gains—over 16% for the S&P 500 and more than 20% for the Nasdaq—and every major Wall Street forecaster is betting the rally has another leg.
Still, this isn’t blind euphoria. AI expectations, economic surprises, Fed uncertainty, and Trump’s next tariff moves are already lurking in the opening chapters of the year.
Meanwhile, gold and silver are ringing in 2026 in breakout mode, building on their strongest annual performances in decades - another signal that investors are hedging optimism with protection.
It’s only Day One. But the tone is set.
Welcome to 2026—let’s trade it smarter.

📈 Dow, S&P 500, Nasdaq Futures Rise as Wall Street Kicks Off 2026
U.S. stock futures climbed to start the new year, with the Dow, S&P 500 and Nasdaq all positioned higher on optimism over a fresh earnings season and resilient economic data driving early 2026 market sentiment.
🚀 Stocks Make Upbeat Start to 2026; Precious Metals Extend Rally
Global equities opened the year on a positive note, supported by strong trading in major markets, while gold and silver continued their sparkling rally amid ongoing safe-haven demand and expectations of future monetary easing.
⚠️ Analyst Issues Warning for Stocks in 2026
A leading market strategist cautioned that equity valuations may face headwinds in 2026 as interest rate uncertainties and potential earnings pressures could challenge investor optimism and flatten upside potential.
🌏 Shares Higher in Asia as Markets Get Off to Upbeat Start in 2026
Asian stock indices rose in early trading, buoyed by positive global cues and a strong start to the year, with sentiment boosted by easing macro risks and expected policy support across major economies.
💥SpaceX, OpenAI, and Anthropic Prepare Historic Listings in 2026
Three private giants — SpaceX, OpenAI, and Anthropic — are lining up for potential IPOs in 2026, with combined valuations topping $1.6 trillion. If even one goes public, it could eclipse every U.S. IPO from 2025 combined. If all three do? It would mark the largest IPO wave Wall Street has ever seen.
📊 Google Tops Nvidia and Microsoft in AI Performance Rankings
In new AI benchmarks, Google outperformed tech giants Nvidia and Microsoft, showcasing superior efficiency in key model training and inference metrics that may reshape competition in the AI tech stack.
₿ Bitcoin Set for First Yearly Loss Since 2022 as Macro Trends Weigh on Crypto
Bitcoin appears poised for its first annual decline since 2022, pressured by tightening macro conditions, dollar strength and fading risk appetite — highlighting broader headwinds facing the crypto market despite recent rallies.

Indicators Are Helpers, Not Decision Makers
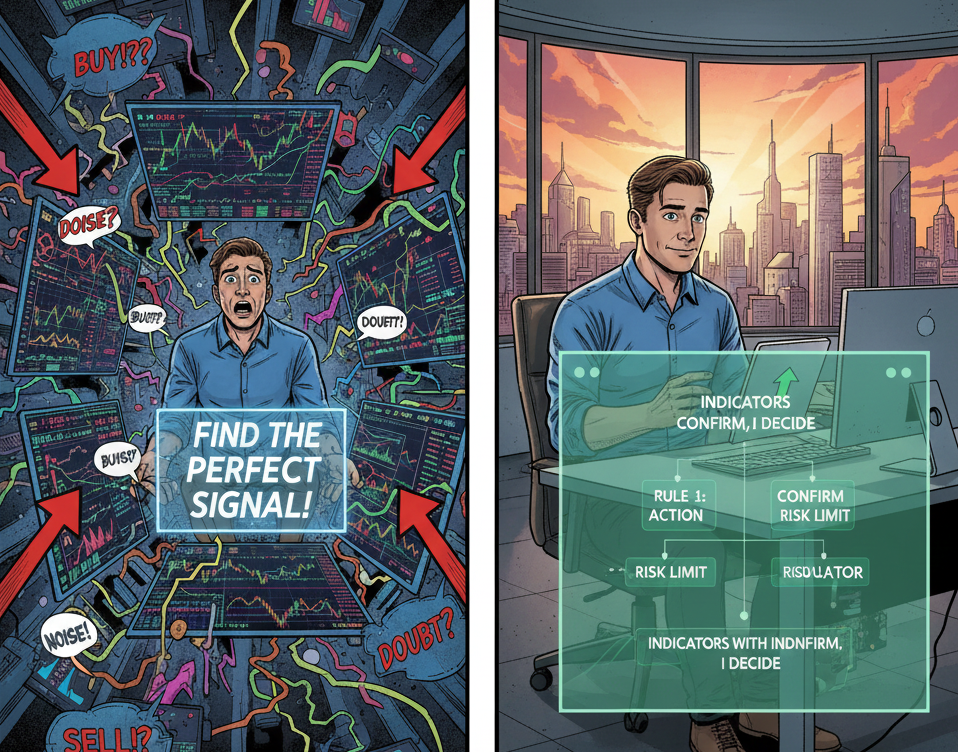
Most traders get stuck searching for the perfect signal. They add more indicators and expect clarity. What they get is noise. Conflicting signals slow decisions and increase doubt.
Indicators serve one role. Support your rules. They do not replace thinking or planning. Price behavior sets direction. Risk rules set limits. Indicators confirm. They never decide.
When you simplify, confidence returns. Fewer tools create faster clarity. Decisions feel grounded because they follow a process, not a signal.
If you want guidance that teaches how to use tools with structure instead of chasing signals, these newsletters help. They focus on clear frameworks and disciplined decision making.

Hull Moving Average (HMA)
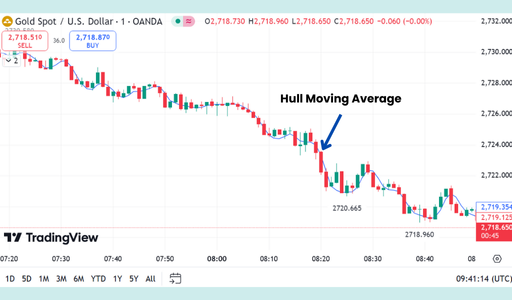
The Hull Moving Average was developed by Alan Hull to solve the biggest problem with traditional moving averages: Lag. By using a unique mathematical calculation, the HMA is extremely fast and smooth, allowing it to "hug" the price action closely while filtering out the "noise" of minor price fluctuations.
🛠️ The Strategy Logic
Use these logical triggers to identify trend changes and momentum shifts in real-time:
- IF: The HMA line changes color (e.g., turns from Red to Green)...
- THEN: A potential trend reversal is occurring. Because the HMA is so reactive, a change in its slope is often the earliest signal that the immediate direction of the market has shifted.
- IF: The price is trading above a rising HMA line...
- THEN: The trend is strongly bullish. In this scenario, you should only look for buy signals or "long" entries, as the HMA acts as a high-speed support level.
- IF: The price crosses from above the HMA to below it...
- THEN: Short-term momentum has broken. This is often a leading signal to exit a long position or to tighten your stop-loss, as the "fast" nature of the HMA catches price drops much earlier than a standard SMA or EMA.
- IF: The HMA line begins to flatten out after a steep climb...
- THEN: The current momentum is reaching exhaustion. This "rounding over" of the HMA suggests the market is entering a consolidation phase or preparing for a reversal.
- IF: You are using a "Fast" HMA (e.g., 9-period) and it crosses a "Slow" HMA (e.g., 21-period)...
- THEN: You have a high-speed crossover signal. When the Fast HMA crosses above the Slow HMA, it confirms a powerful acceleration in buying pressure.
💡 Pro Tip
Beware the "Whipsaw": Because the HMA is so incredibly fast, it is prone to "whipsaws" (false signals) in sideways or choppy markets. To maximize its power, don't trade the HMA in isolation. Only take HMA direction signals that align with a higher-timeframe trend or a volume indicator like the MFI. If the HMA says "Buy" but the volume is falling, it’s likely a trap.

The Echo of Past Trades
Every trade leaves a residue.

You don’t see it on the chart, but it sits in your head.
A big win tells you that you’re sharp.
You size up faster. You wait less. You start believing your read matters more than your rules.
That confidence feels earned, but it quietly bends your judgment.
A big loss does the opposite.
You hesitate. You cut winners early.
You tighten stops for comfort, not logic. You start trading to avoid pain instead of to follow your edge.
Both states feel rational in the moment. Neither is neutral.
The market does not know what you made yesterday.
It does not care what you lost last week. But your brain keeps replaying those moments, whispering suggestions into the next decision.
Good traders learn to clear the slate. Not emotionally numb. Just clean.
Each trade deserves its own evaluation. Its own risk. Its own execution.
When you let the past trade the present, you stop responding to price. You start responding to memory.
And memory is a terrible risk manager.
The skill is simple to describe and hard to practice.
Treat every setup like it is the first one of the day.
No revenge. No celebration. Just process.