
$1T Pay Approved
....................................................................................................................


TGIF — but Wall Street isn’t exactly celebrating just yet.
After a bruising tech sell-off sent markets tumbling, futures are inching higher this morning as traders try to steady their footing.
The Nasdaq is clawing back a bit after heavy losses in Nvidia, AMD, and Microsoft triggered a midweek rout that rattled sentiment across the board.
Still, the week’s been rough: the S&P 500 is down nearly 2%, the Nasdaq almost 3%, and October’s job-cut data just hit its worst level for the month in two decades — a not-so-subtle reminder that cracks are still forming beneath the surface.
But not all’s doom and gloom. Investors are eyeing a few potential lifelines: whispers of a December Fed cut, the government shutdown finally nearing its end, and Tesla’s massive $1 trillion Musk pay package lighting up headlines.
Add in fresh anticipation for Nvidia’s next earnings report and the stage is set for a potentially volatile finish to the week.
Markets are trying to breathe again… but no one’s relaxing just yet.
Let’s check what’s moving 👇

💰 Elon Musk’s $1 Trillion Deal Heads to Vote
At Tesla, Inc.’s annual meeting, shareholders will decide on a pay‐package that could award Musk up to US $1 trillion if he drives the company to a market cap of roughly US $8.5 trillion over the next decade.
⬇️ Futures Slide as Volatility Holds Grip
Futures on the Nasdaq‑100 and S&P 500 slipped around 0.26 % and 0.15 % respectively amid entrenched market jitters and high retail bearish sentiment.
🎨 Figma, Inc.’s Q3 Blasts Past: $274.2 M Revenue
Q3 revenue rose 38 % YoY to US $274.2 million, pushing Figma’s annual run-rate past the US $1 billion mark with AI tools now driving much of the growth.
🇨🇳 China Returns to Market with US$4 B Bond Sale
People’s Republic of China issued roughly US $4 billion in dollar‐denominated bonds, drawing order books in excess of US $65 billion highlighting strong global appetite despite geopolitical risks.
💸 Buy Alibaba Group Holding Ltd., Sell Meituan!
Investors betting long on Alibaba and short on Meituan have seen returns of roughly 130 % year-to-date, as Meituan faces mounting losses in the deepening price-war with Alibaba’s instant-retail push.
🧱 Bitcoin Faces ‘Insane’ Sell Wall Above US$105K
Bitcoin is pinned below US $105,000 by a huge cluster of sell orders stretching toward US $112,000, while stock‐markets await a key tariff ruling that could ripple through the crypto space.
🪙 Gold Reclaims US$4,000/oz as Dollar Slips
Spot gold climbed to roughly US $4,011.79/oz, while December futures rose to about US $4,021.20/oz, driven by a weaker dollar and concerns over the prolonged U.S. government shutdown.

The Only Insider Knowledge Worth Having
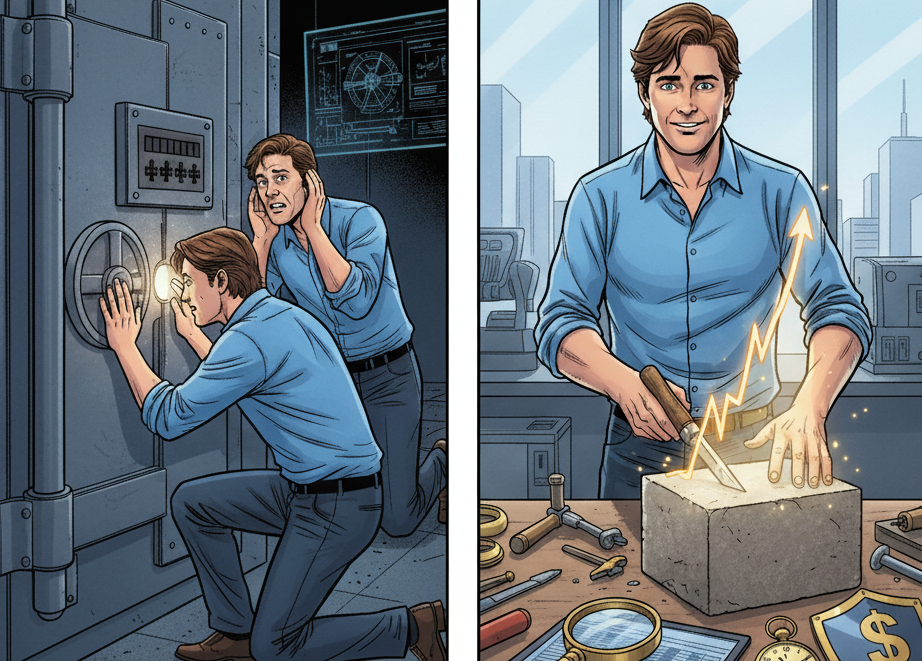
The only insider knowledge worth having is skill.
Most traders think someone out there has secret information. They don’t.
Profitable traders understand their process, not a password-protected secret.
They study data, stay patient, and protect capital. They treat trading like a craft, not a chase.
These newsletters explain how that mindset works.
They cover market structure, discipline, and emotional control.
They show how traders stay consistent when conditions shift.
If you want to stop chasing phantom tips and start learning the methods that actually work, these newsletters will show you how to think, plan, and trade like a professional.

Pivot Points
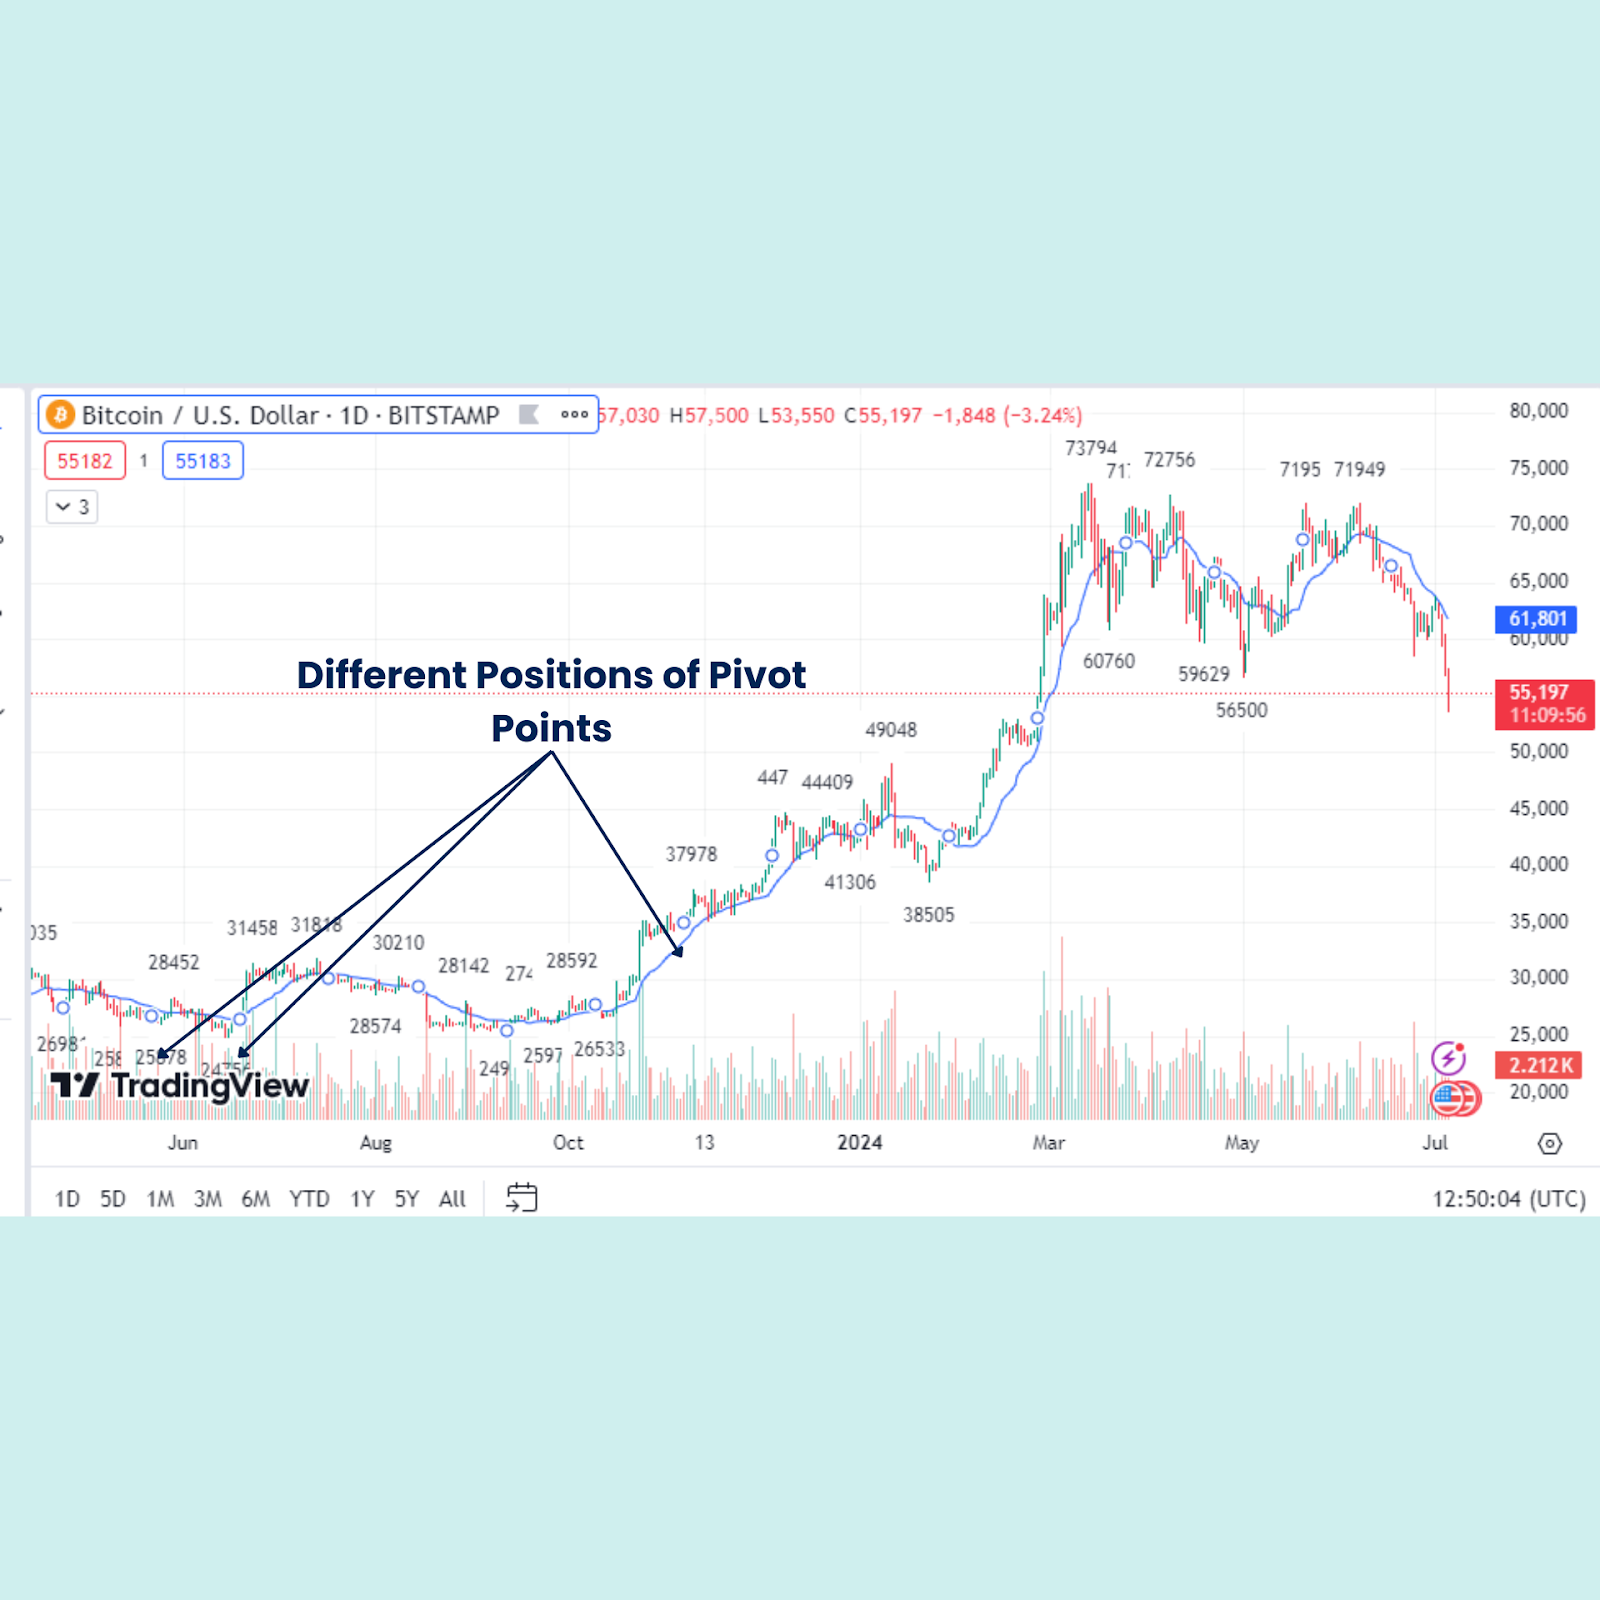
Pivot Points (PPs) are a widely used technical analysis tool that helps traders identify potential support and resistance levels for the current trading period.
Unlike many subjective indicators, Pivot Points are objective and mathematically derived, calculated using a simple average of the previous period's High, Low, and Closing prices.
The central Pivot Point acts as a primary reference level, with additional calculated Support (S) and Resistance (R) levels branching out from it.
They are particularly popular among day traders because the levels remain fixed throughout the trading day,
What to Look For (Key Features and Signals)
The classic (or standard) Pivot Point system generates five to seven fixed price levels based on the previous period's data.
- The Central Pivot Point (PP): This is the most crucial level. It is seen as the line of equilibrium or "fair value."
- Market Sentiment: If the price is consistently trading above the PP, it indicates a bullish market sentiment for the period. If the price is consistently trading below the PP, it indicates a bearish market sentiment.
- Market Sentiment: If the price is consistently trading above the PP, it indicates a bullish market sentiment for the period. If the price is consistently trading below the PP, it indicates a bearish market sentiment.
- Support and Resistance Levels: Above the PP are Resistance levels (R1, R2, R3), and below the PP are Support levels (S1, S2, S3).
- R1 and S1 are the most commonly tested and are used for range trading and short-term bounces.
- R2/S2 and R3/S3 represent stronger, more extreme levels that are typically targeted during strong trending or breakout days.
- Bounce Strategy (Range Trading): In a non-trending market, traders look for the price to bounce off the support and resistance levels.
- Look to buy when the price tests S1 or S2 and reverses upward.
- Look to sell (short) when the price tests R1 or R2 and reverses downward.
- Breakout Strategy (Trend Trading): When the price breaks decisively through the R1 or S1 level, it confirms a strong trend.
- A break above R1 signals a strong uptrend, with R2 or R3 becoming the next potential targets.
- A break below S1 signals a strong downtrend, with S2 or S3 becoming the next potential targets.
- Confluence: Pivot Points are highly effective when they align with other support and resistance zones (e.g., trend lines or Fibonacci levels). When a Pivot level (S or R) coincides with another known level, it strengthens its significance.

The Dopamine Drain

Winning feels good.
That hit of excitement when a trade goes right can light you up inside.
But that same rush is what gets traders wrecked.
It tricks you into thinking you’re untouchable.
You start forcing setups, chasing momentum, adding size.
You confuse luck with skill.
You stop following your plan because your brain is too high on the last win.
That’s the dopamine drain - the quiet addiction to the feeling of being right.
It’s subtle, but it eats away at your discipline.
You stop seeing the market as a game of probabilities and start seeing it as a validation machine.
You need another win, not another good trade.
The best traders understand this.
They celebrate briefly, then reset.
They treat a win the same way they treat a loss - as data.
The goal isn’t to feel good after every trade.
It’s to stay steady enough to keep trading when the feeling fades.
The traders who last aren’t the ones who chase the rush.
They’re the ones who protect their edge from it.


